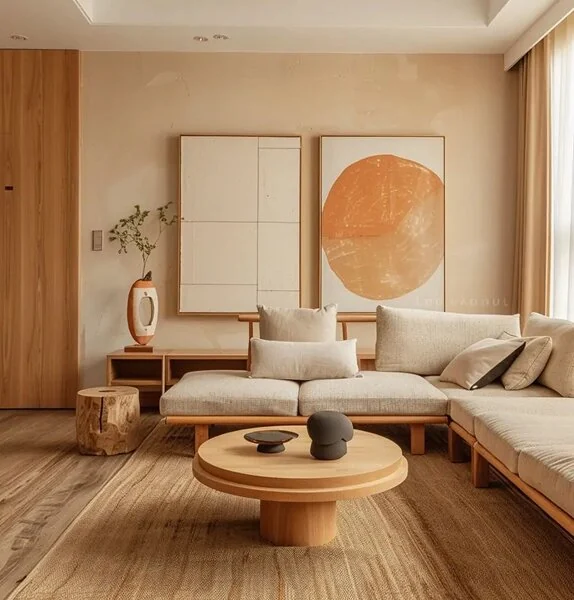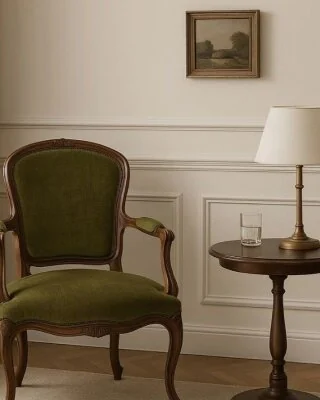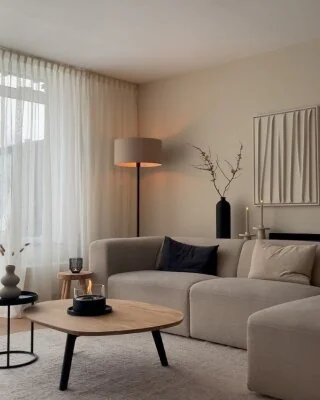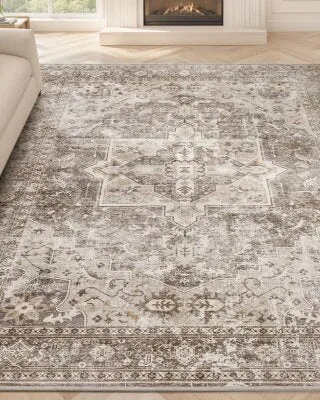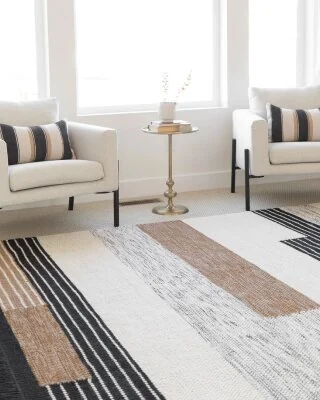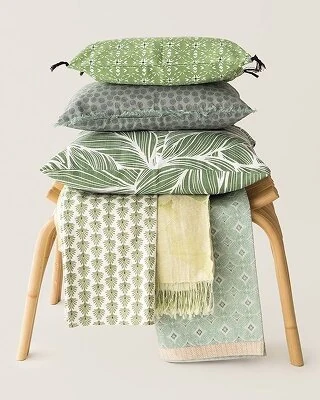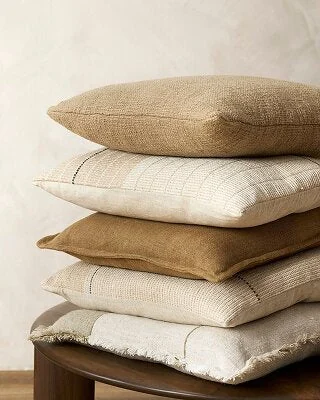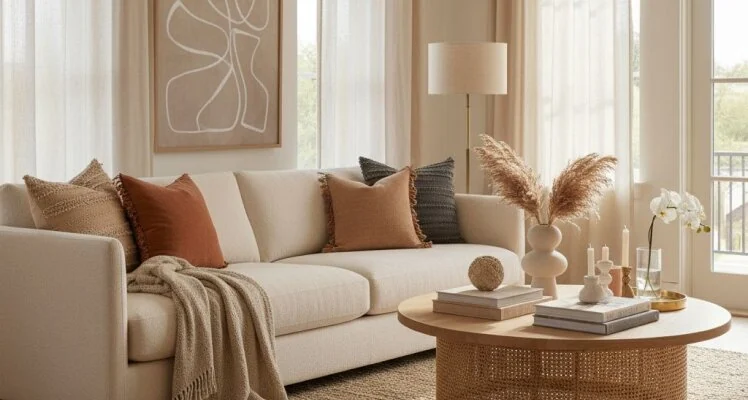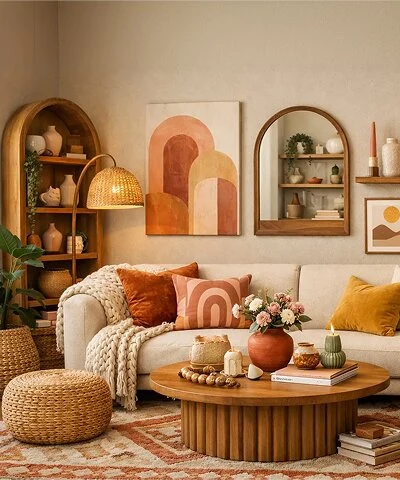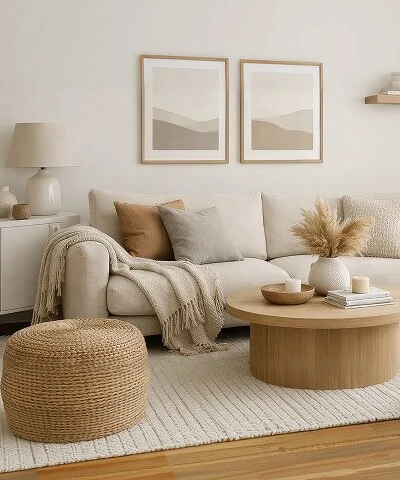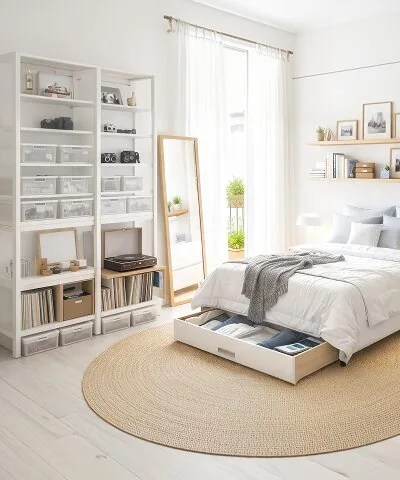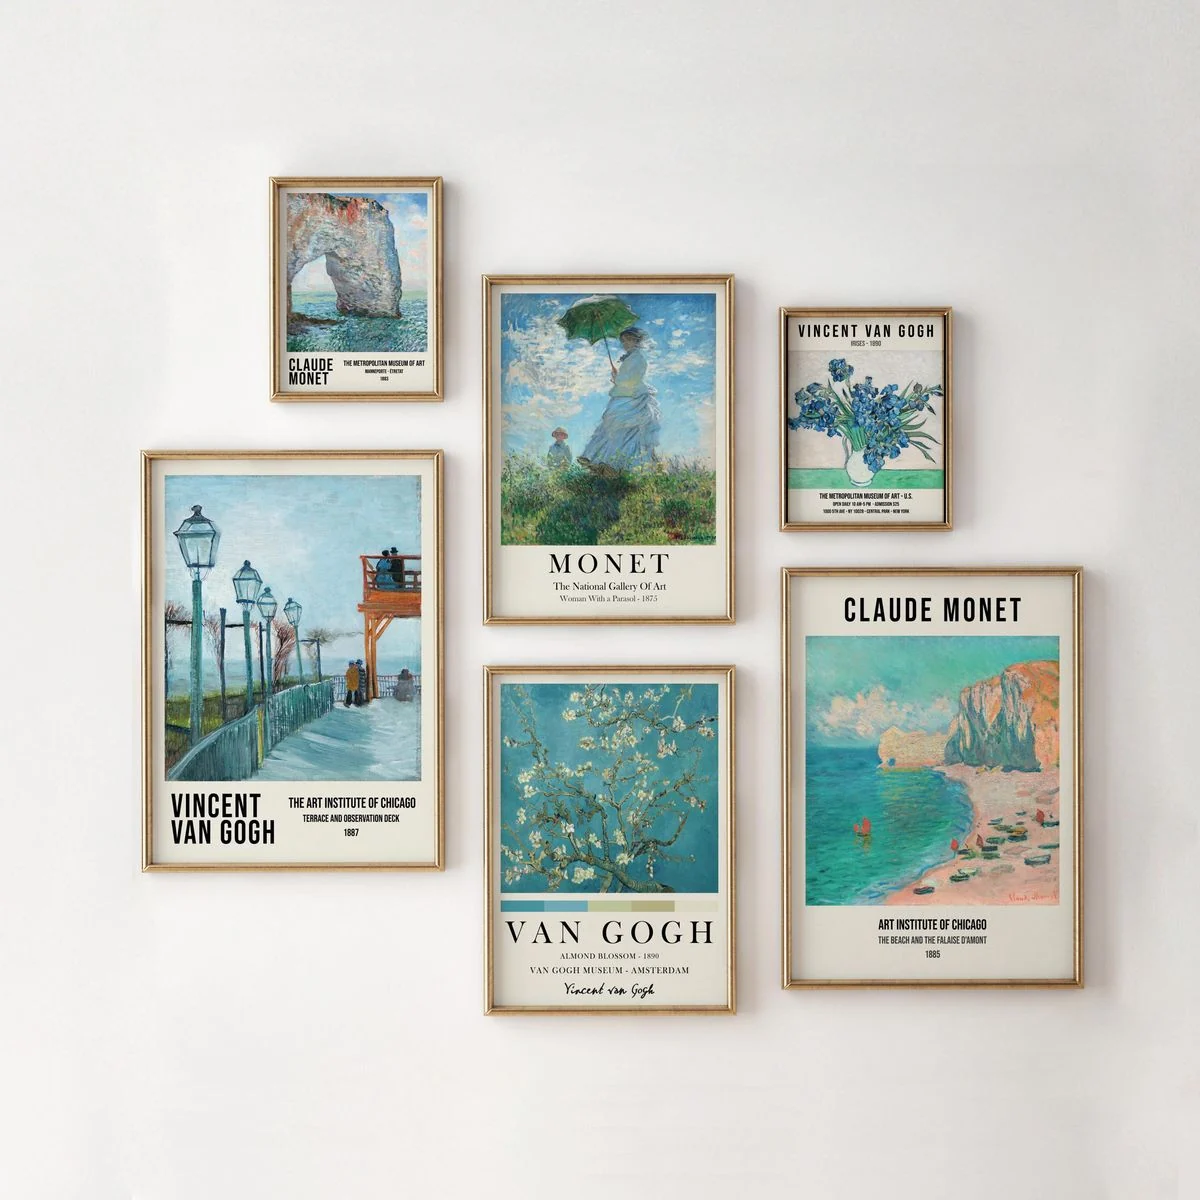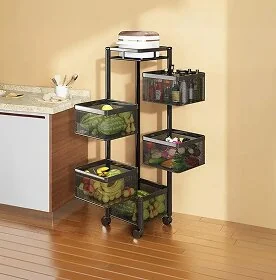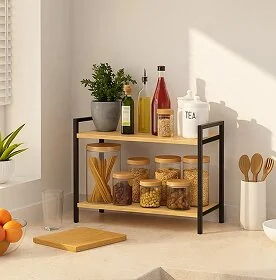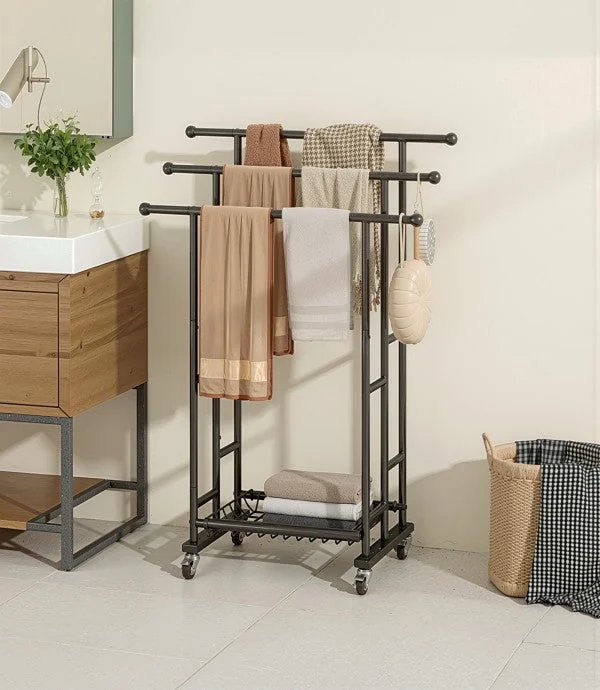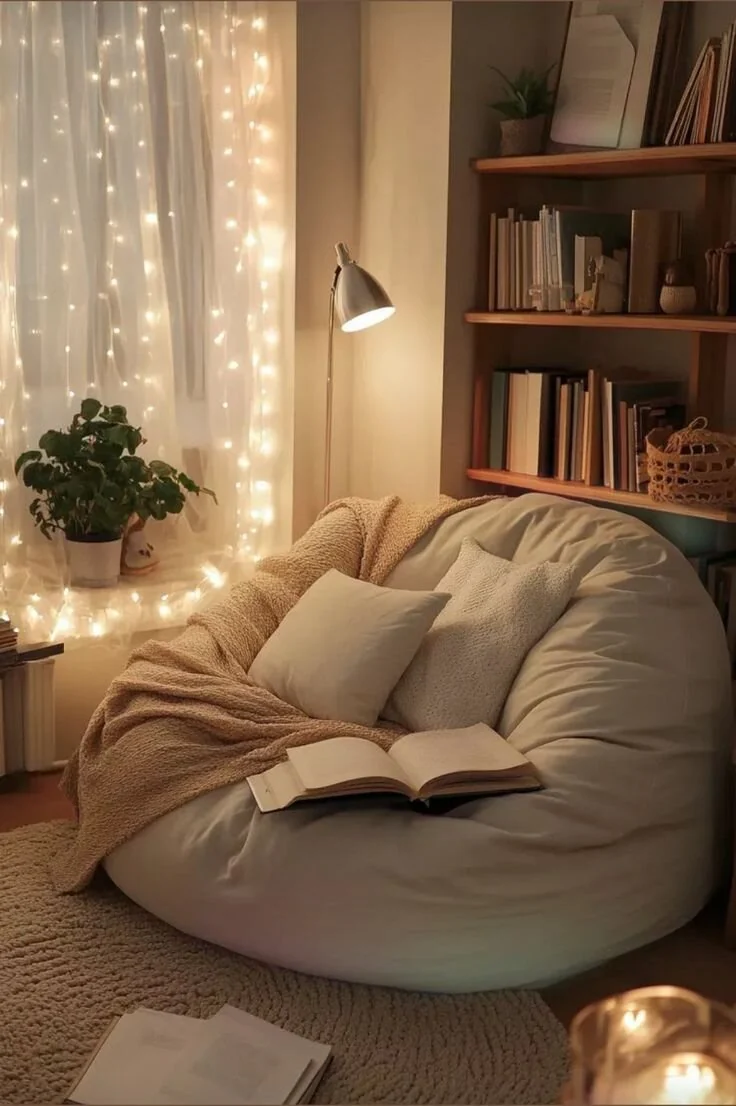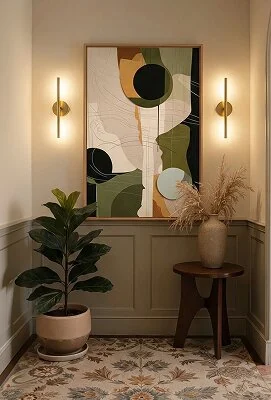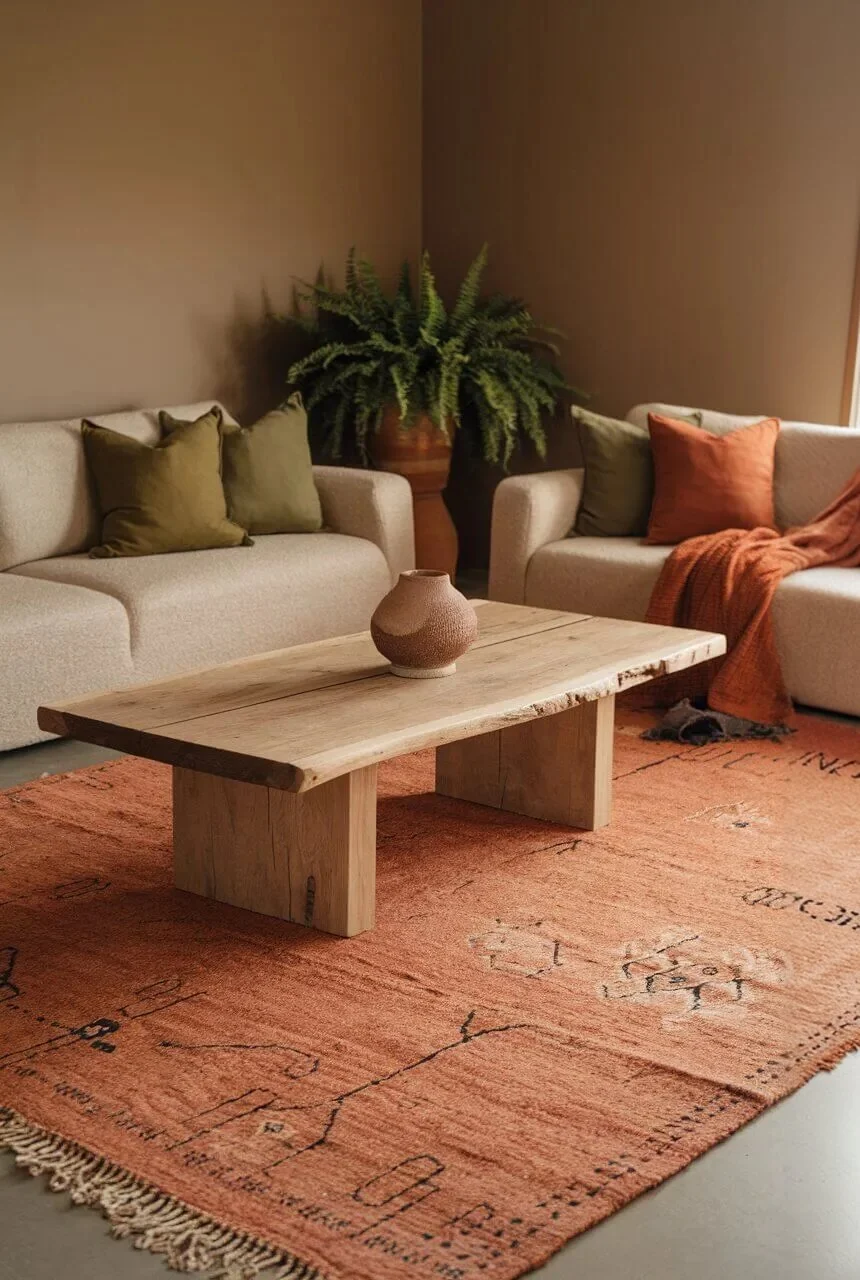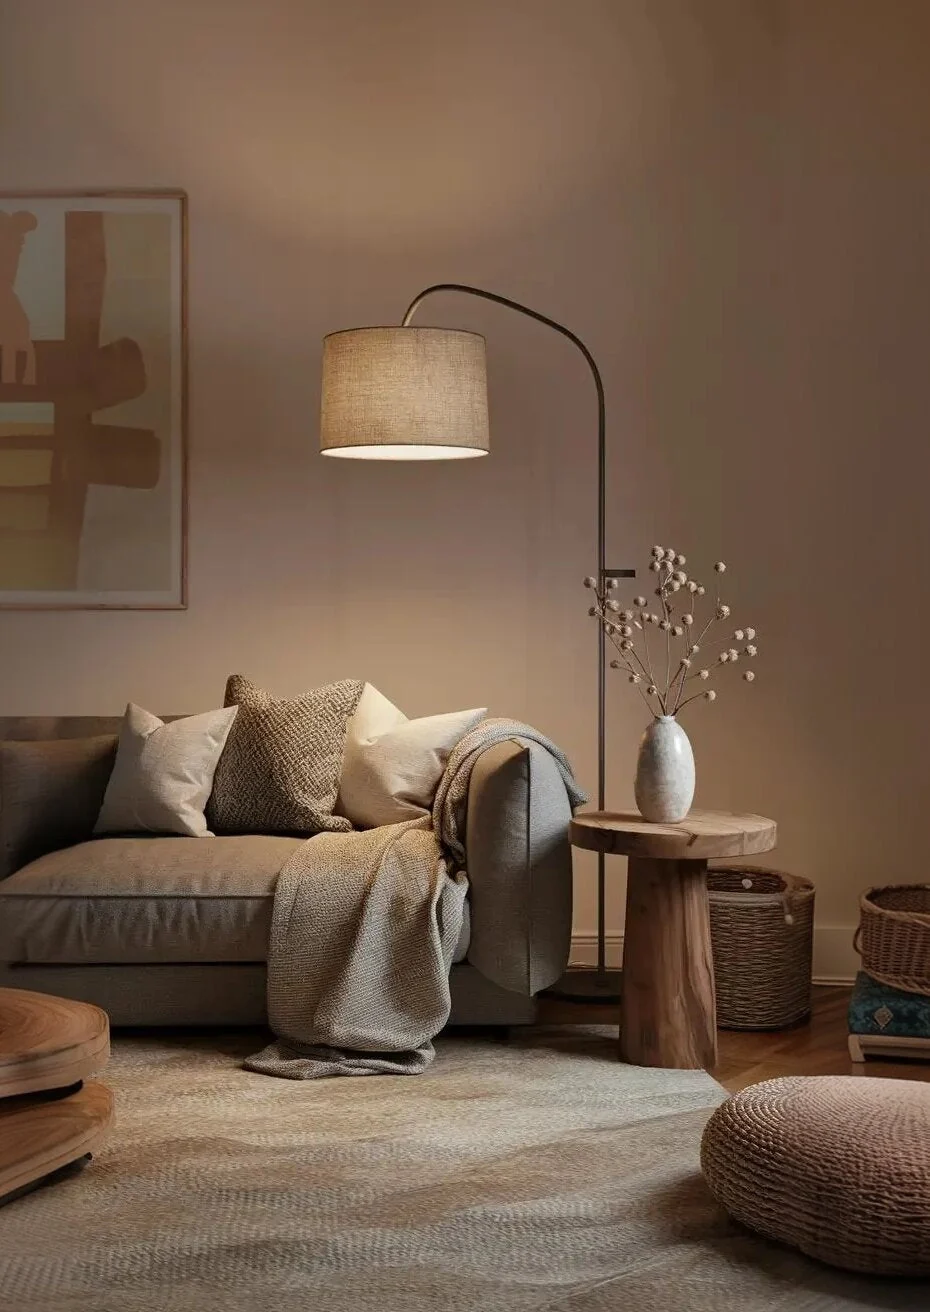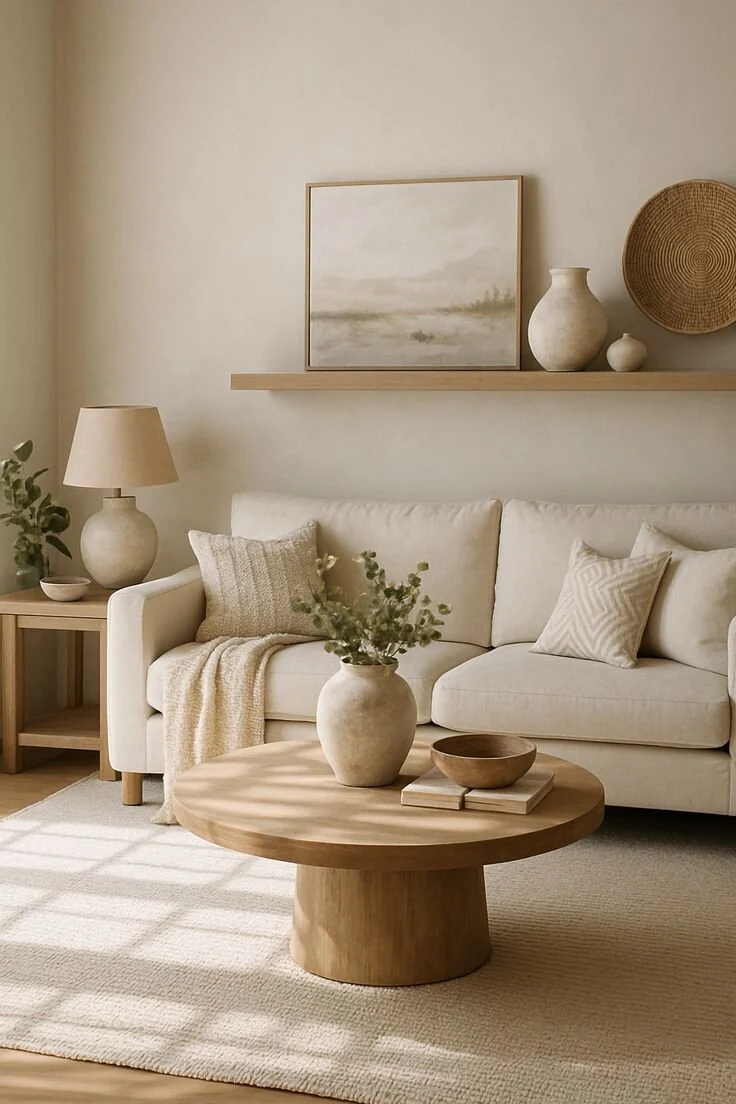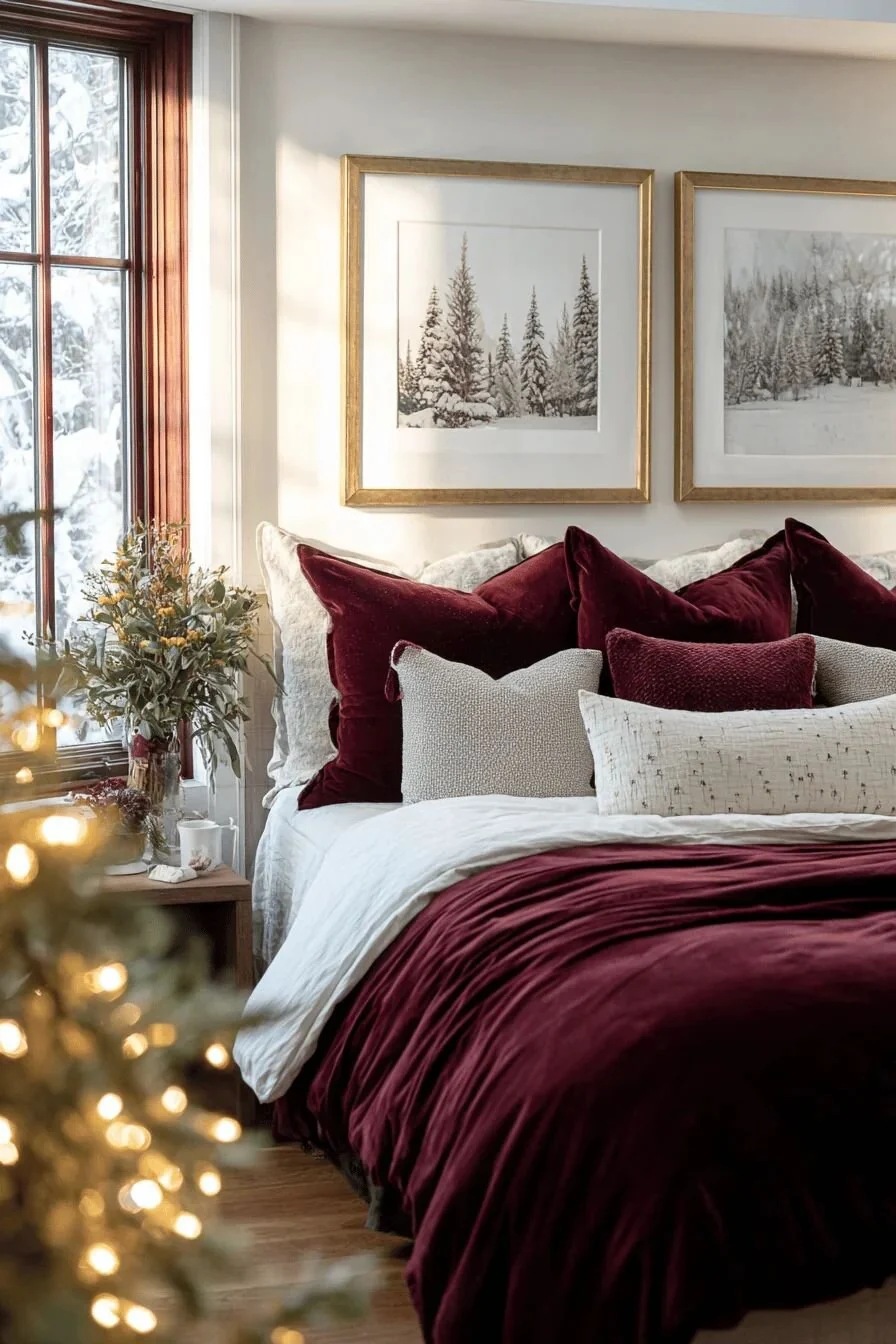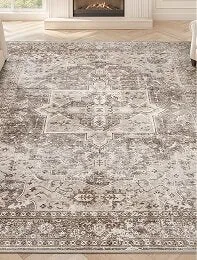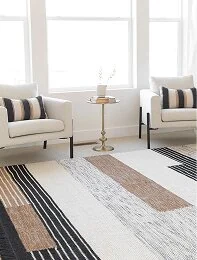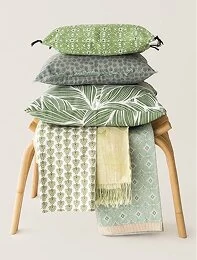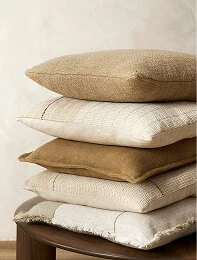
Promotional bannerPromotional banner
Home Index
2025
How India styled its homes in 2025
About Home Index
The Vaaree Home Index 2025 examines how Indian homes are evolving. What people buy, how they style their spaces, and what this says about everyday life. This edition draws on data across 100,000+ products and 45+ million sessions, and is designed as a repeatable benchmark of changing tastes and emerging trends.

By combining transaction data with search and browsing behaviour, the report captures both intent and action. Together, these signals help us see that homes moved beyond functional basics and towards more intentional, cohesive styling. They have become an active expression of comfort, identity, and aspiration.
Table of Content
1. Executive Summary
2. The Vaaree Dataset
3. The Vaaree Home Index
4. The 10 Trends of 2025
5. Regional & City Insights
6. The Forecast: 2026
7. Appendix
The 2025 Home in 5 Shifts
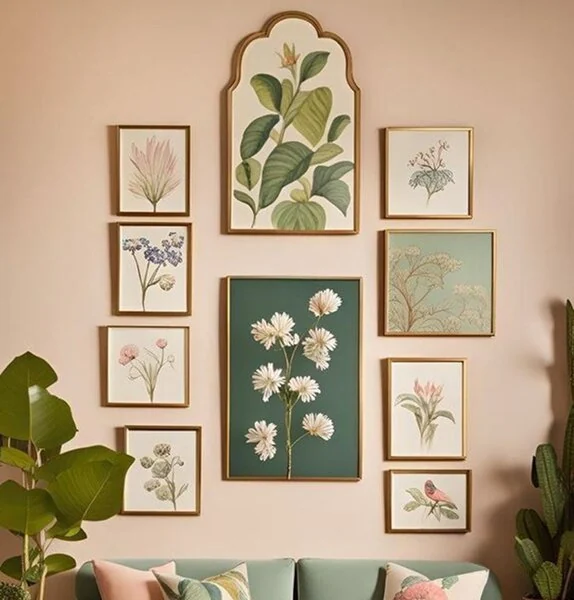
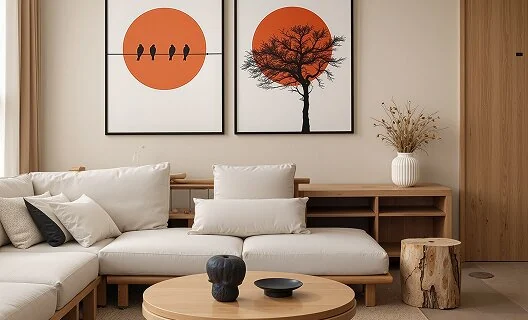
Walls Became Identity
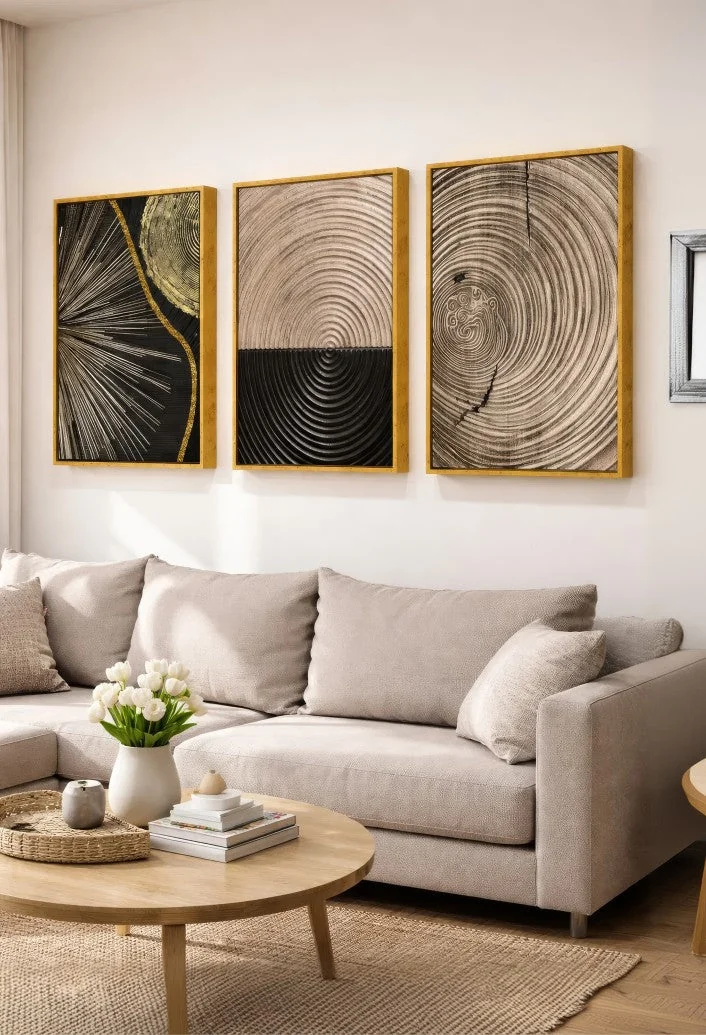
Indian homes increasingly used walls as the primary styling surface to express personality without changing the space.
signals
64% increase in wall decor adoption, making it one of the strongest drivers of styling behaviour.
1
2
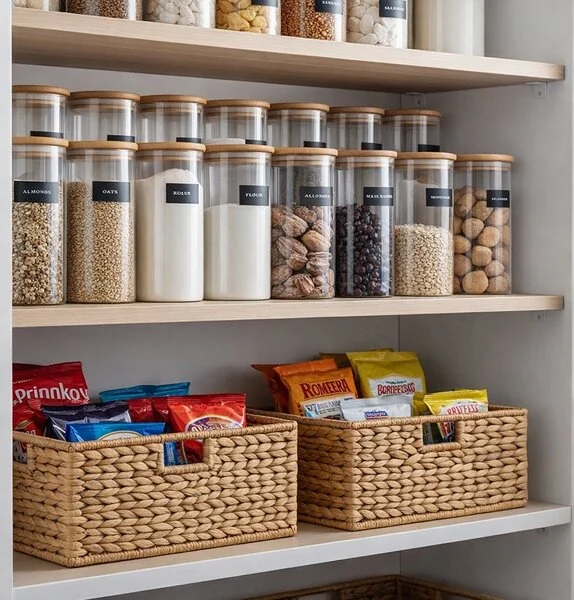
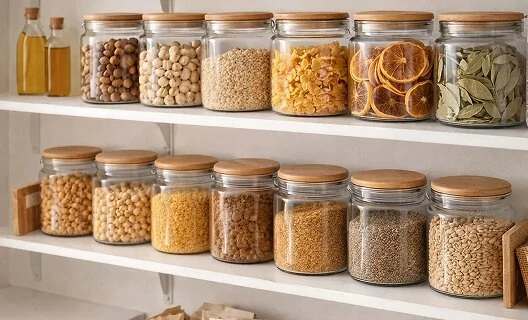
Storage Became Aesthetic
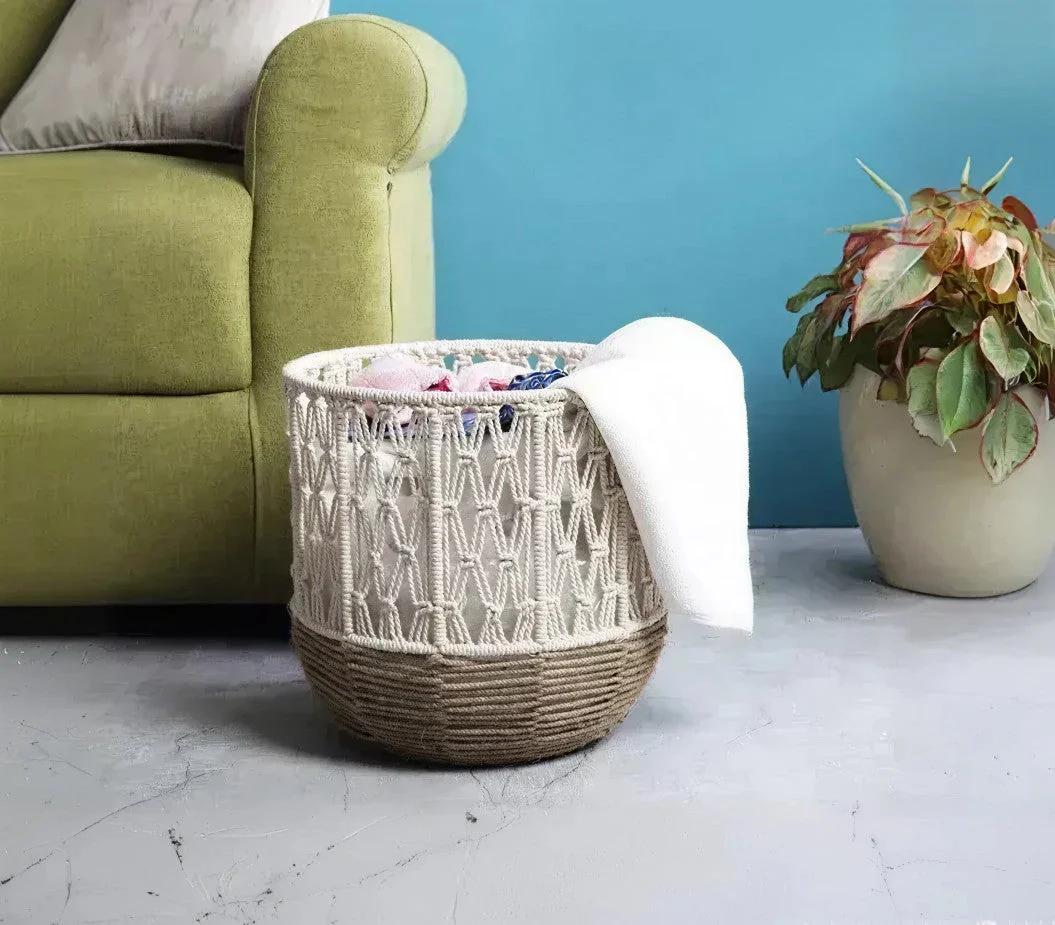
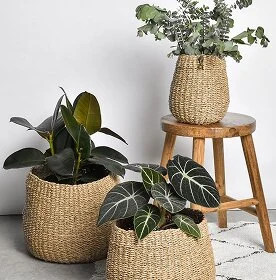
Organisation shifted from utility to lifestyle. Storage became visible and design-led.
signals
168% increase in adoption for storage & organisers
4x increase in multi-item storage basket adoption
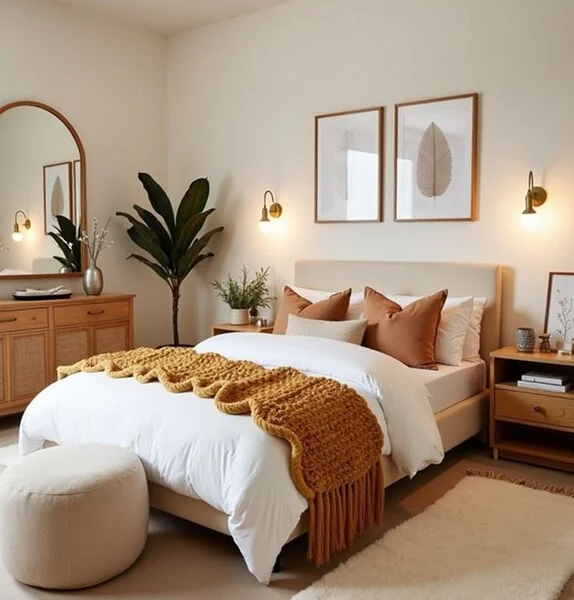
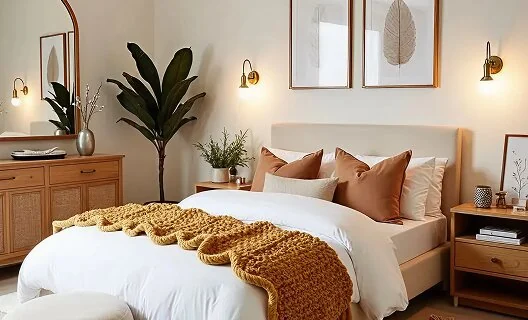
Comfort Became Design
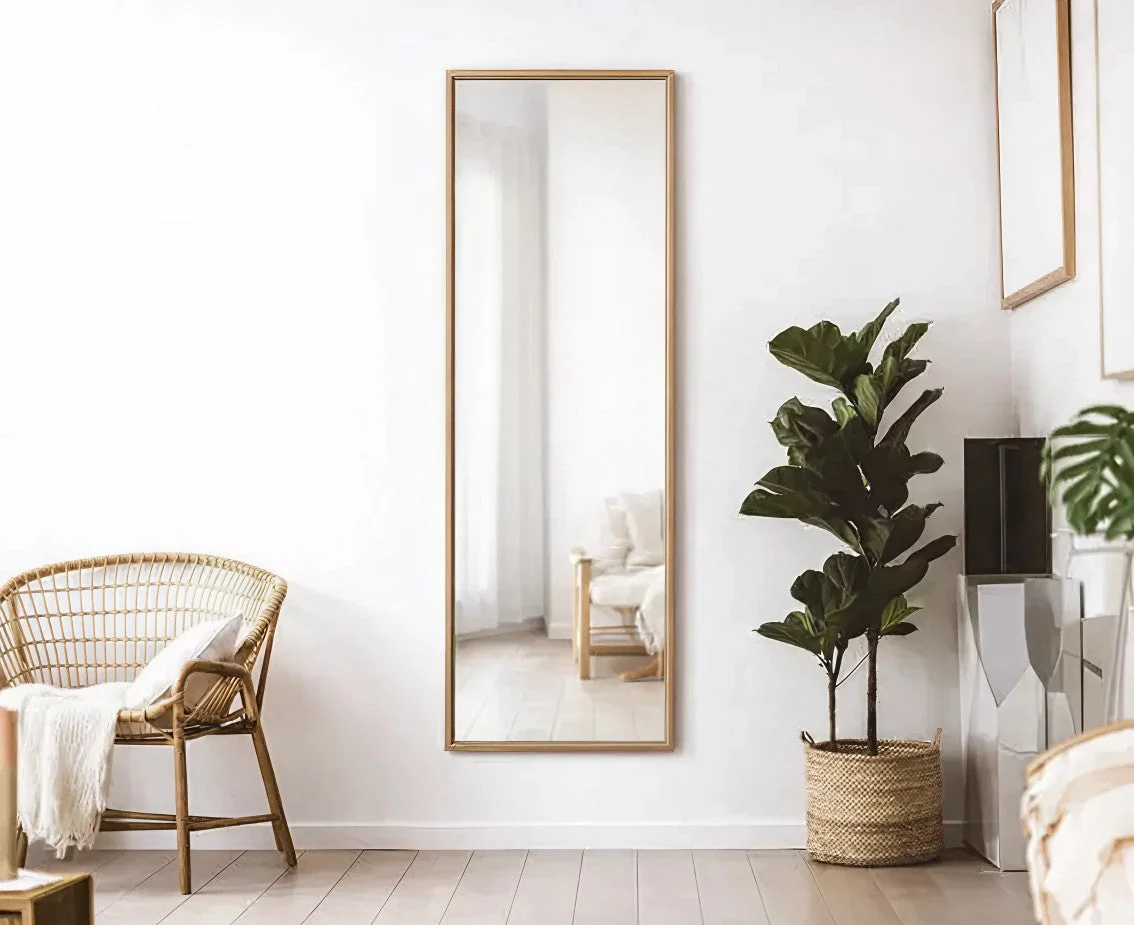
Softness and warmth moved from nice-to-have to must-have. Rugs, cushions, and bedsheets became anchors of comfort-led interiors.
signals
141% increase in adoption of Comfort category products
90% higher adoption for rugs/carpets
3
4
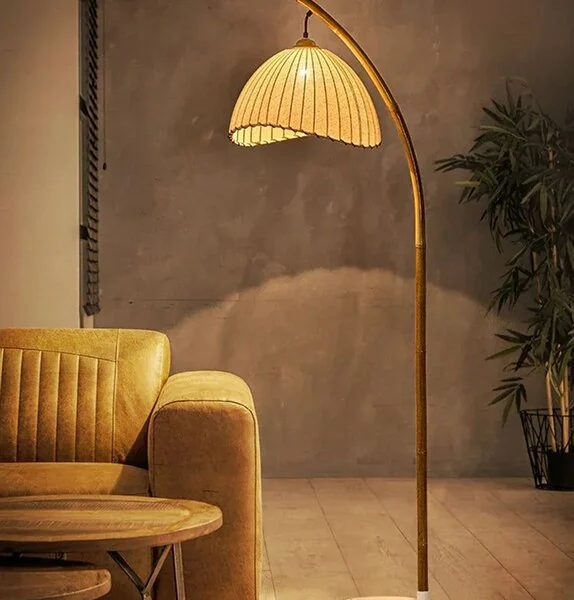
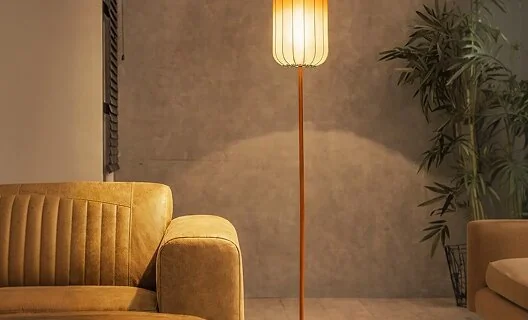
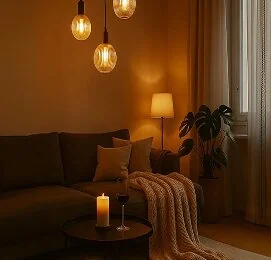
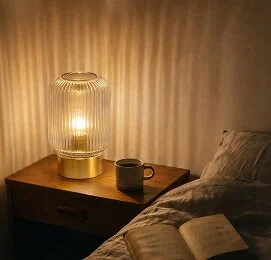
Lighting Became Mood
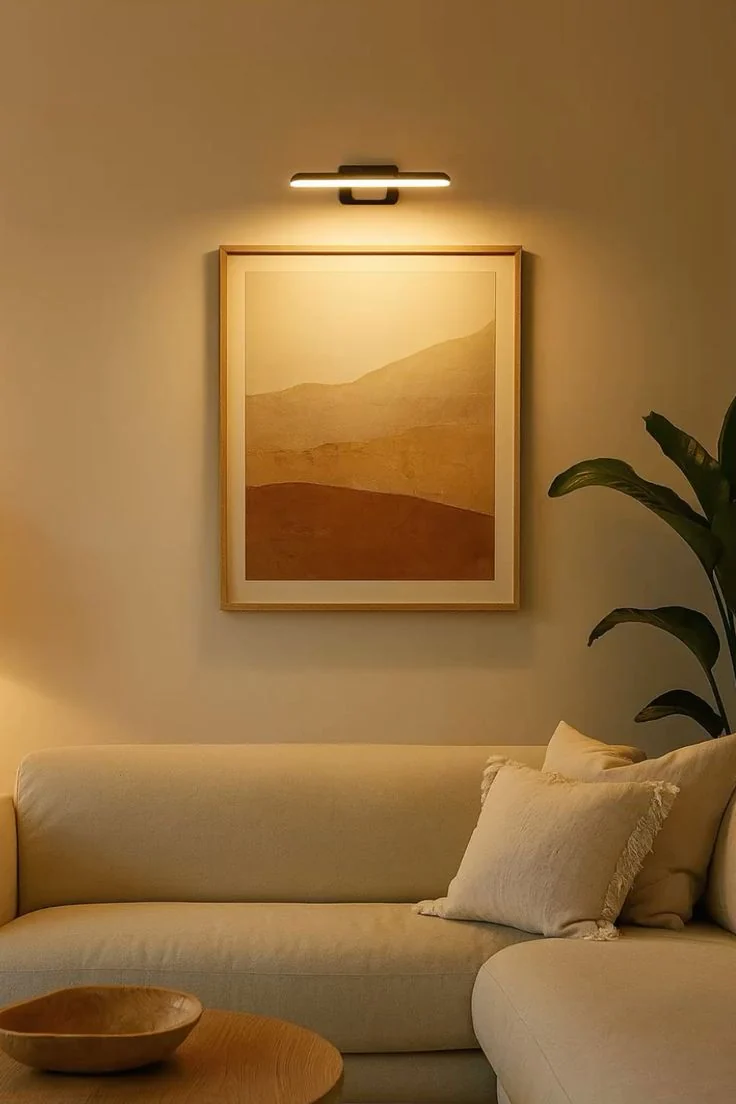
Lighting shifted from brightness to atmosphere. Homes increasingly used lamps and ambient lighting as part of décor.
signals
70% increase in adoption of lamps & lighting
Majority customers searched for warm or ambient lighting styles
Consumers Buy Looks, Not Products
Home styling became modular. Customers increasingly built coordinated looks through cross-category combinations.
signals
62% increase in cross-category purchase
Wall Art + Wall Accents was the preferred purchase combination
5
Three Big Contradictions
These gaps between browsing and buying reveal where aspiration is running ahead of adoption, which is often the earliest signal of future trends.
WHAT CUSTOMERS BROWSED
3.5 million shoppers browsed 'Classic' decor (10% higher than minimalist decor)
WHAT CUSTOMERS PURCHASED
Yet, minimalist decor products outsold classic by 25%
WHAT CUSTOMERS BROWSED
400K+ shoppers viewed Classic rugs (22% higher than modern design rugs)
WHAT CUSTOMERS PURCHASED
Yet, modern rugs had 60% more orders than classic rugs
WHAT CUSTOMERS BROWSED
“Natural” furnishings design had 1M views (34% higher than minimalist products)
WHAT CUSTOMERS PURCHASED
But, minimalist design furnishings had 20% higher order than natural design furnishings
In 2025, the Indian home continued its shift from being purely functional to deeply personal. Across India, people weren't just decorating, they were shaping comfort, forming small daily rituals, and using their spaces to reflect who they are. Across Vaaree's dataset, categories tied to comfort, storage, and identity consistently outpaced functional basics in growth.
At its core, the 2025 home was about one simple thing: making everyday life feel better through warmth, order, mood, and self-expression.
Some of this change is structural. Homes are getting smaller, cities denser, and work more hybrid, turning the home into a space that has to do many jobs at once. But there's an emotional layer too. After years of constant lifestyle change, people are spending more time indoors and asking more of their homes. More warmth. Better organisation. A stronger sense of personality.
The clearest signal in 2025 was the rise of intentional styling. Categories that once felt optional: wall art, mood lighting, styling accents, premium organisers started to behave like essentials. Comfort-led categories such as rugs and soft furnishings picked up pace. Functional items like racks, shelves, and containers began to matter not just for utility, but for how they looked.
What stood out wasn't just higher consumption, but greater discernment. People moved away from buying isolated products and towards building cohesive looks. This showed up clearly in search behaviour, with growing use of style-led terms like "modern," "boho," "minimal," "warm," and "gold." Purchases followed the same pattern, with stronger adoption of identity-led and comfort-led categories.
The Aesthetic Spectrum
Indian homes didn't move in one direction, rather, they spread across a spectrum of aesthetics. What we observed wasn't a single trend, but four dominant styling directions that defined the year.

These aesthetics are not mutually exclusive. Many homes blend them. Together, they reveal the core story of 2025: the home became more personal, intentional, and design-aware.
Warm Minimalism
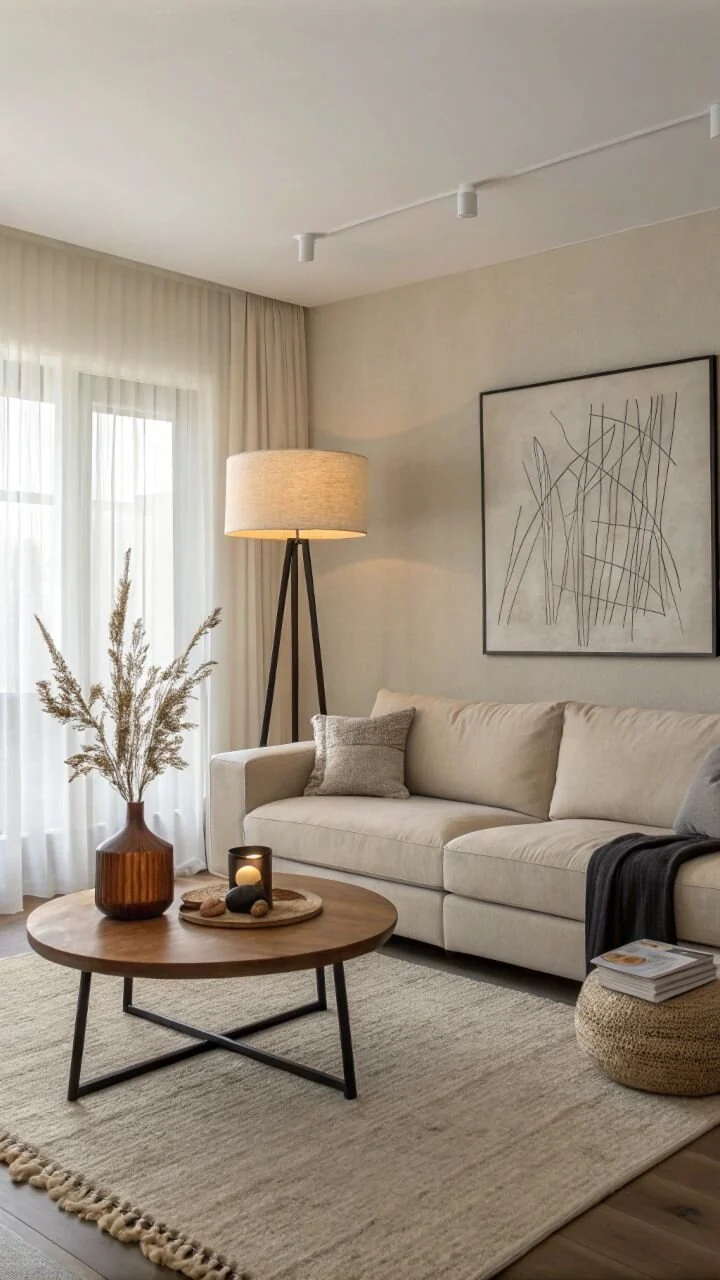
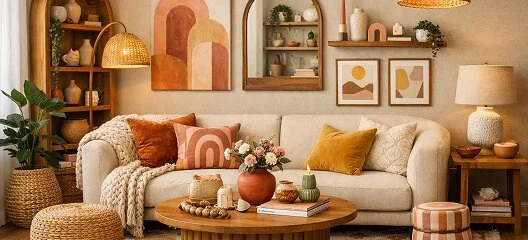
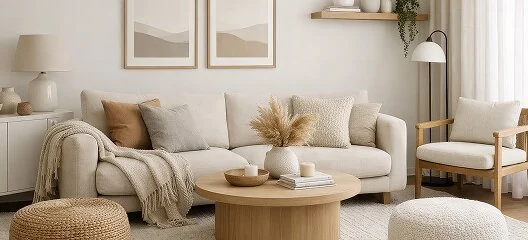
Clean spaces, but with warmth: earthy tones, textured rugs, mood lighting, curated objects.
Soft Maximalism
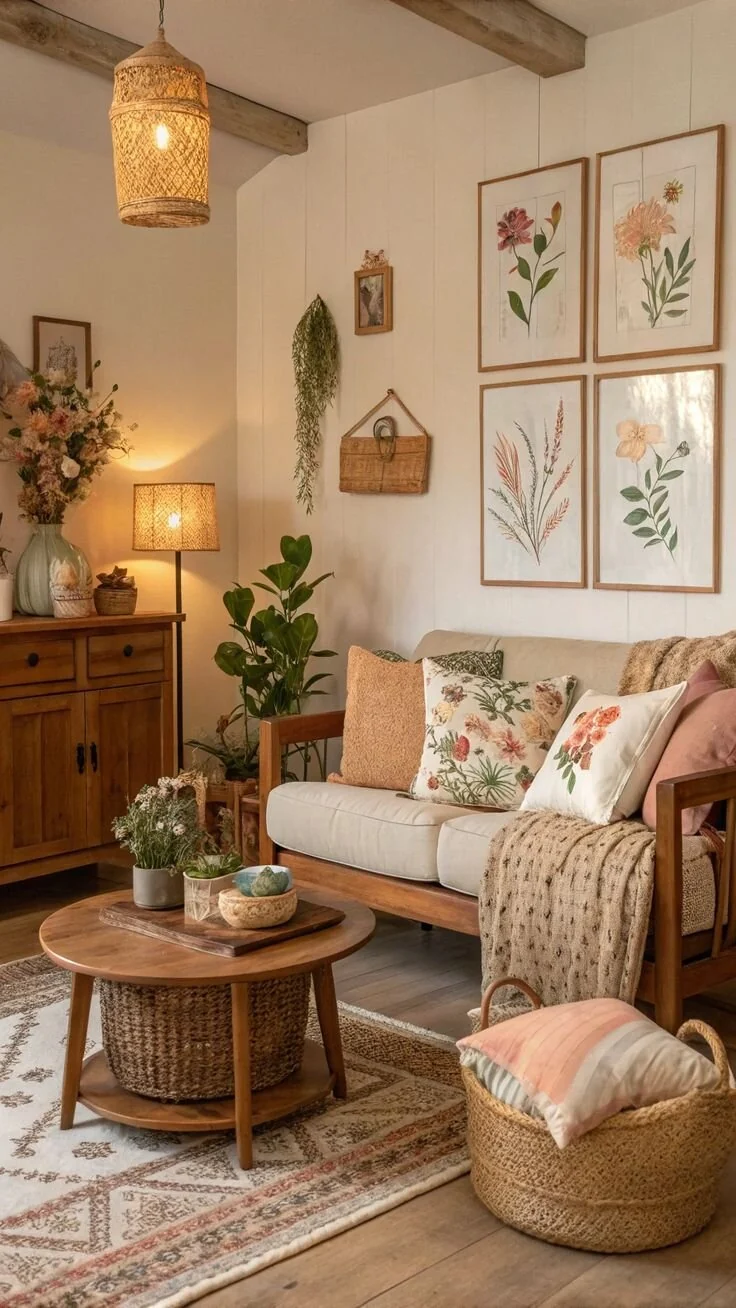
More colour, more layers but cohesive. Patterned cushions, statement wall decor, bold artefacts.
Modern Indian
Contemporary design infused with Indian sensibility, traditional motifs, warm metals, design that feels rooted yet current.
Functional Chic
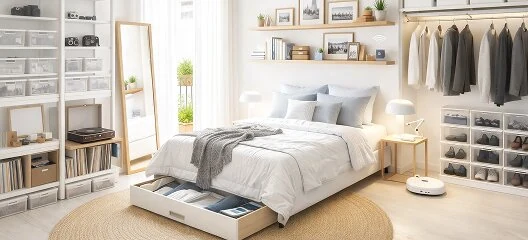
The fastest-growing aesthetic: storage that looks premium, organization as styling, shelves that become décor.
The Vaaree Data Lens
This report combines what people bought, what they searched for, and how they browsed not opinions or surveys. That triangulation is what turns commerce data into cultural insight.
Time period: 1st Jan 2024 to 31st December 2025
Geography: India, with focus on top 20 cities
48
categories
150
product types
85,000+
SKUs in Catalog
500K
Customers
1M+
Units sold
1M+
Searches
100M+
Product viewS
Introducing
Vaaree Home Index
The three indexes represent the three dominant forces shaping Indian homes today: expression, comfort, and space efficiency. Together, they capture the majority of observed home styling behaviour without over-complicating interpretation.
1
The Styling Index
National Average Index
77
Style index indicates how much a city and customer segment styles their home beyond functional basics i.e., how much they buy for “aesthetic expression.”
Style Index = Aesthetic Adoption x Styling Frequency x Styling Intent
A high Styling index means:
Purchase aesthetic and identity-led decor at a higher rate relative to overall home purchases
Style across multiple categories rather than making isolated purchases
Show strong styling intent through search and browsing behaviour
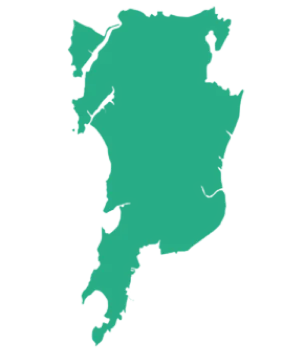
Mumbai continues to lead the way in home styling.
Jaipur jumps 4 positions to become the second most stylish city!
Indore, Lucknow, and Nagpur have taken massive leaps forward in home styling in 2025
Styling Leaderboard
(Rank difference of 2025 vs 2024)
1
Mumbai
(120)
1
1
Jaipur
(119)
4
2
1
Bangalore
(116)
3
1
Indore
(116)
8
4
1
Delhi NCR
(115)
3
5
6
Ahmedabad
(115)
4
7
Lucknow
(112)
8
8
Pune
(110)
3
9
Nagpur
(107)
8
10
Kolkata
(105)
6
11
Chandigarh
(102)
3
12
Goa
(102)
5
13
Hyderabad
(100)
4
14
Bhopal
(99)
4
15
Chennai
(97)
1
16
Dehradun
(96)
17
Surat
(94)
6
18
Vadodara
(93)
5
19
Thiruvananthapuram
(88)
20
Coimbatore
(83)
2
The Comfort Index
National Average Index
47
The comfort index indicates how strongly customers are optimising their homes for comfort, softness, and coziness. A shift toward home-as-retreat.
Comfort Index = Soft Furnishing Adoption x Comfort Upgrades x Comfort Intent
A high comfort index means:
Purchase comfort categories more frequently relative to overall home purchases
Show repeat and upgrade behaviour in soft furnishings
Express strong comfort intent through search and browsing
Mumbai leads in home comfort, with Bangalore and Hyderabad closing in fast
Lucknow, Jaipur and Indore take big leaps forward in the comfort index compared to last year
Comfort Leaderboard
(Rank difference of 2025 vs 2024)
1
Mumbai
(116)
1
1
Bangalore
(111)
1
2
1
Hyderabad
(95)
2
3
1
Kolkata
(95)
2
4
1
Ahmedabad
(94)
3
5
6
Lucknow
(94)
6
7
Chennai
(94)
1
8
Delhi ncr
(93)
1
9
Pune
(92)
5
10
Jaipur
(77)
7
11
Goa
(76)
2
12
Indore
(74)
8
13
Nagpur
(73)
2
14
Chandigarh
(70)
2
15
Coimbatore
(69)
16
Surat
(68)
2
17
Dehradun
(64)
2
18
Vadodara
(60)
19
Thiruvananthapuram
(59)
9
20
Bhopal
(59)
7
3
The Space-Saver Index
National Average Index
50
Space-saver index indicates how strongly households optimise for small-space living using storage, organisation, and multi-use solutions.
Space-Saver Index = Storage Adoption x Organisation Sophistication x Small-Space Intent
A high space-saver index means:
Adopt storage and organisation products at a higher rate per order
Engage in deeper organising behaviour rather than one-off purchases
Show strong intent to optimise space through search and browsing
Mumbai jumps two position to lead the space saver index
Nagpur moved up 9 positions, while Indore dropped by 6 positions in the space-saver index
Space-saver Leaderboard
(Rank difference of 2025 vs 2024)
1
Mumbai
(118)
2
1
1
Bangalore
(117)
2
1
Chennai
(117)
2
3
1
Coimbatore
(104)
3
4
1
Hyderabad
(103)
1
5
6
Pune
(94)
1
7
Delhi ncr
(94)
1
8
Ahmedabad
(87)
2
9
Kolkata
(85)
2
10
Lucknow
(82)
1
11
Nagpur
(78)
9
12
Thiruvananthapuram
(78)
13
Surat
(71)
2
14
Indore
(70)
6
15
Goa
(70)
4
16
Chandigarh
(69)
17
Vadodara
(64)
4
18
Jaipur
(64)
4
19
Bhopal
(64)
1
20
Dehradun
(55)
3
Dig Deep
The 10 Trends of 2025
Trend 01
Walls Became Identity
In 2025, walls became the new “identity surface” of Indian homes to easily style a space without changing it. Customers weren’t just buying individual products, they were building walls as expressions of personality: modern, boho, minimal, traditional, maximalist, etc.
220% lift in repeat customer preference
70% increase in unites sold for Wall decor
Key reasons for this trend
1
Homes became personal brands, with walls serving as the most visible expression of taste.
2
Wall décor offers a high-impact upgrade that’s easy to change, especially for renters.
3
Social media shifted décor shopping toward aesthetic-led language and inspiration.
In demand Art forms
Pichwai
Macrame
Madhubani
Jharokha
Rising Subjects
7 Horses
Lotus
Evil Eye
Tree of Life
How to Style your wall?
Build a theme wall: one material + one palette + one anchor piece
Use “rule of three”: 3 frames / 3 artefacts / 3 visual elements
Pair wall décor with warm lighting (table lamp / wall light) to create depth
For small spaces: choose vertical elements (mirrors, tall frames) to increase height
Trend 02
Storage Became Aesthetic
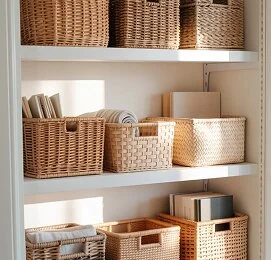
In 2025, storage wasn’t just about organisation. It became a design category. Consumers increasingly chose containers, shelves, racks, and organisers that looked premium and complemented the home’s aesthetic.
Key reasons for this trend
1
Compact Indian homes are driving demand for smart, space-saving storage that blends function with design.
2
Home organization has evolved into an aspirational lifestyle fueled by decluttering and productivity culture.
3
Consumers now expect organizers to be both highly functional and visually pleasing for open display.
270% YoY growth in Home Storage & Organization
1.35 Average storage products sold per storage orders
Leading organiser types
Kitchen
Keys
Shoes
Clothes
Tips to organise aestheticly
Use open storage as display : baskets + styling objects
Create visible zones: kitchen, bathroom, entryway
Pair storage with plants or showpieces to soften utilitarian forms
For small spaces: stack vertically (tall racks, shelves)
Trend 03
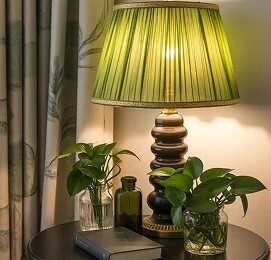
Lighting became Mood
In 2025, lighting moved from utility to atmosphere, where homes began to style with mood, not brightness. Customers increasingly treated lamps and ambient lighting as part of décor especially as homes became more experiential spaces for relaxing, working, and hosting.
Tips for ambient lightning
Create a mood corner: lamp + rug + plant
Mix heights: table lamp + floor lamp + wall accents
Use warm light (not harsh white) in living spaces
Place lighting beside frames/art to create depth
Key reasons for this trend
1
As rooms serve multiple purposes, lighting enables quick mood changes without altering the setup.
2
Consumers now value warmth, ambience, and coziness over purely functional lighting.
3
Lamps have become styling elements that complement decor pieces to create curated corners.
70% increase in adoptions of lamps & lightning
Top searched lamp materials
Wooden
Ceramic
Rattan
Fabric
Trend 04
The Comfort Economy
In 2025, comfort became a design choice. Softness moved from “nice-to-have” to “must-have.” Comfort categories like rugs, carpets, bedsheets, and cushion covers saw strong momentum in 2025 not only as functional upgrades, but as styling anchors. Instead of treating soft furnishings as basics, customers increasingly used them to set the mood of a room: warm textures, layered surfaces, and softer palettes.
Key reasons for this trend
1
Homes are now seen as emotional sanctuaries where comfort supports daily well-being.
2
Soft furnishings offer the quickest, low-commitment way to transform a room’s look and feel.
3
Consumers are shifting from print-focused choices to texture-driven, mood-based styling.
102% growth in Rugs & Carpets GMV
42% increase in ASP for cushion covers
Top comfort searches
Bedsheet
Cushion cover
Curtains
Rug
Carpet
Sofa Cover
How to Style it?
Start with a rug, use it to anchor the palette of the room
Layer softness: rug + cushion covers + warm lighting
Use “tone-on-tone” neutrals for warmth without clutter
Refresh seasonally: lighter fabrics in summer, deeper tones in winter
Trend 05
Nature Moves Indoors
In 2025, Indian homes brought nature inside. Greenery became an aesthetic language, not just decor. Artificial plants and nature-inspired styling became one of the clearest signals of the “calmer home” trend. For many homes, greenery served as the bridge between function and beauty.
Key reasons for this trend
1
Warm minimalism has elevated natural textures and greenery as core elements of modern interiors.
2
Plants offer an easy, renter-friendly way to refresh spaces without major changes.
3
Greenery helps urban homes reclaim a sense of openness, freshness, and calm.
Most searched plant terms
Dried flowers
Pampas grass
Coral Tree
Sunflowers
Monstera
Bougainvillea
Orchid
Olive Tree
Palm Plant
Almiro Tree
Fiddle Leaf
109% growth in orders for artificial plants and flowers
82% growth in search intent: “artificial plants”, “green decor”, “indoor plants”
Cities with highest greenery adoption in 2025
Goa
Lucknow
Thiruvananthapuram
Bangalore
Delhi NCR
How to style your green corner?
Create a green corner: plant + lamp + small rug
Use height variation: floor plant + table plant + hanging option
Pair greenery with neutral storage baskets for “functional chic”
Add a vase/artefact to make it feel curated
Trend 06
The ‘Functional Chic’ Home
In 2025, the most modern homes weren’t the most decorative they were the most functional, styled beautifully.

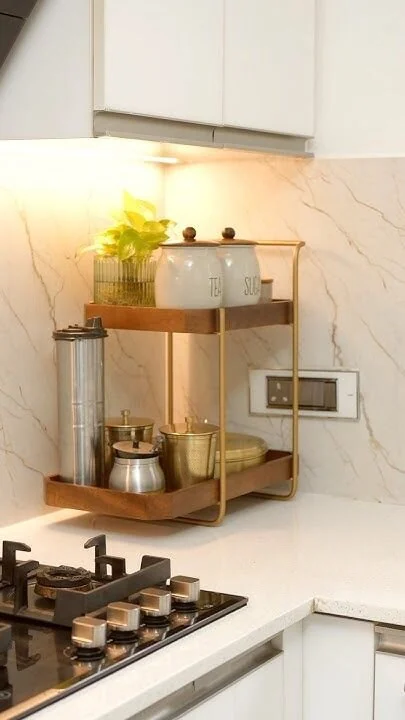
Racks, shelves, and organisers weren’t just bought as storage, they were increasingly used as display infrastructure. Customers treated shelves as design elements, and racks as part of the room’s aesthetic rather than something hidden away.

This shift marks the rise of “functional chic”. Utility products act as the canvas for styling. Shelves hold plants and showpieces, organisers sit visibly on counters, and racks become part of kitchen and bathroom decor.
How to Style it?
Treat shelves like curated zones: 60% storage + 40% decor
Add 1 plant + 1 lamp + 1 object for visual balance
Use baskets and containers for hidden storage within open shelves
Keep a consistent palette (neutral baskets + warm metals + greenery)
Key reasons for this trend
1
Limited floor space pushed homes toward vertical storage, making shelf design as important as function.
2
Utility organizers are now expected to visually align with clean, minimal, and premium interiors.
3
Shelves have evolved into display systems that express personal style, not just storage.
300% higher customer adoption for racks & shelves
13% of racks purchasers also bought organisers
200% increase in search intent.
Leading search terms
Wall shelf
Shoe rack
Kitchen rack
Book shelf
Dish rack
Microwave stand
Trend 07
Affordable Luxury Accents
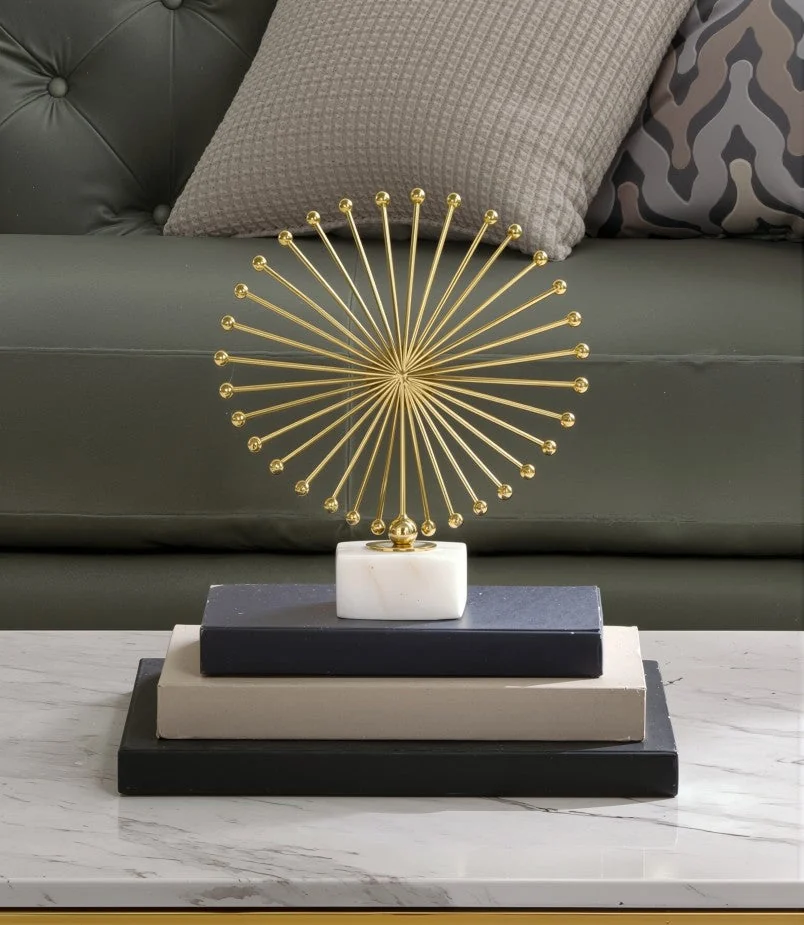
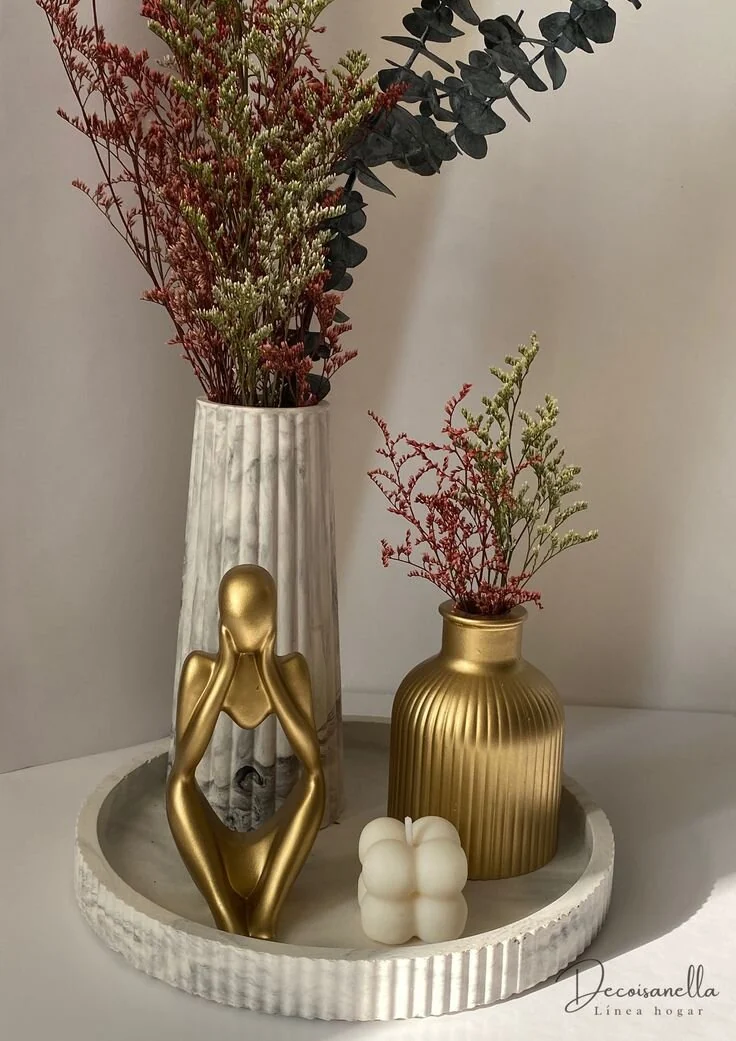
In 2025, luxury didn’t grow, Affordable luxury did. Homes chose “premium-looking” accents over expensive upgrades. Consumers increasingly expressed aspiration through small but high-impact upgrades: artefacts, showpieces, vases, premium decor objects, and statement accents. Rather than investing in big-ticket furniture, shoppers leaned into objects that elevate a space instantly and photograph beautifully.
Key reasons for this trend
1
Consumers are refreshing their spaces through small upgrades rather than full home renovations.
2
Greater exposure to aspirational design has made “everyday luxury” more attainable through accents.
3
Homes are increasingly curated to reflect personal taste through intentional, well-chosen objects.
60% growth in customers choosing luxury decor
300% faster adoption of luxury in decor vs space saving products
Top luxe intent search terms
Chandelier
Big vase
Sculpture
Designer wall clock
Golden Planter
Ceramic table lamp
Satin bedsheet
Brass decor
Fur Rug
How to Style it?
Use one “statement object” per zone
Choose a consistent metal tone (gold/brass/silver)
Pair premium objects with neutral palettes for contrast
Place accents near lighting to create a luxury glow
Trend 08
The Styled Hosting Home
In 2025, hosting became aesthetic. Barware and serving categories moved from kitchen storage to living room display. Barware, hosting, and serving aesthetics gained momentum in 2025, reflecting a deeper lifestyle shift: the home is increasingly a social space again. Consumers weren’t just purchasing for functionality; they were building “hosting corners” — bar sets, glassware, trays, and statement serveware that also functions as decor.
Key reasons for this trend
1
Homes are increasingly serving as the main venue for socializing and hosting.
2
Social media has turned hosting setups into aspirational, style-led moments.
3
Barware reflects a shift toward intentional home rituals tied to celebration and identity.
72% growth in customers buying hosting products
400% hosting-led searches increased
Most popularly paired products were Serving Trays with
Tissue Holders
Containers
Showpieces
Vases
Artificial flowers
Tips for aesthetic hosting
Create a hosting corner: shelf + barware + warm lamp
Use trays for “organized display”
Pair glassware with one statement vase/object
Keep a single theme: modern, vintage, or minimal
Trend 09
Festival Styling Became Editorial
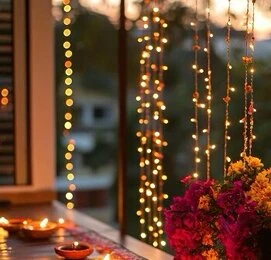
In 2025, festival decor shifted from tradition to trend where homes styled for festivals like they style for social media. Consumers showed increasing interest in cohesive festive themes: coordinated lighting, warm tones, premium-looking accents, and a curated aesthetic rather than scattered decoration.
How to Style it?
Choose a theme: warm gold, earthy traditional, or modern minimal
Use one statement decor object and repeat it (symmetry)
Layer lighting: warm lamps + string lights
Refresh with reusable elements: trays, vases, premium artifacts
Key reasons for this trend
1
Festivals have evolved into lifestyle and social occasions, not just religious observances.
2
Consumers want traditions that feel modern, visual, and shareable.
3
Festivals are now key moments for home refresh and decor investment.
Cities with highest festive styling
Nagpur
Mumbai
Chandigarh
Delhi NCR
Indore
Trend 10
Buying Looks, Not Products
In 2025, customers increasingly bought coordinated looks; not individual products. Styling became modular and bundle-led. Customers weren’t shopping in silos, they were shopping in combinations: wall decor paired with lighting, rugs paired with cushion covers, shelves paired with plants and artefacts. This behaviour suggests the rise of a more styling-aware consumer.
29% higher repeat behaviour for customers buying 3+ categories
580% higher conversion when browsing “Looks” instead of products
Key reasons for this trend
1
Consumers now buy decor as part of a cohesive vibe rather than standalone items.
2
Homes are styled in visual zones, influenced by content and social media framing.
3
Home upgrades are increasingly done in modular, corner-by-corner transformations.
Tips to create the perfect look
Create a look formula: one anchor + two complements + one texture
Repeat the same palette across the look
Use height variety (small + medium + tall objects)
Geographic Analysis
City Spotlights
Delhi NCR
Delhi NCR is India’s most balanced decor market with no single category dominating, but strong depth across cushions, wall decor and soft furnishings. It reflects a broad, multi-category styling culture rather than a single-product bias.
No category has 100% higher preference than national average
Bangalore
Bangalore over-indexes in rugs and carpets, signalling a preference for layered, floor-led styling rather than surface-level accents. Buyers here invest in foundational decor pieces.
90% higher preference for Rugs & Carpets compared to other cities
Rugs AOV in Bangalore higher than national average
Mumbai
Mumbai stands out for its disproportionate spend on cushion covers and accent textiles. The city prefers quick visual upgrades over structural decor changes.
112% higher preference for Cushion Covers than other cities
Cushion AOV in Mumbai higher than national average
Hyderabad
Hyderabad shows a strong tilt toward cookware within the top categories blending decor with functional premium purchases. It’s the most utility-forward major metro in the dataset.
101% higher preference for Cookware than other cities
Cookware AOV higher than national average
Pune
Pune mirrors Mumbai’s accent-driven behaviour, with cushion covers significantly over-indexing. The city leans toward soft styling updates.
80% higher preference for Cushion Covers than other cities
Cushion AOV in Pune higher than national average
Chennai
Chennai over-indexes sharply in racks and shelves making it the most organisation-oriented city in the dataset. Storage and structure matter here.
139% higher preference for Racks & Shelves than other cities
Storage AOV in Chennai lower than national average
Kolkata
Kolkata shows a clear bias toward soft furnishings, especially cushions, over hard decor. Its styling preference is layered and textile-led.
87% higher preference for Cushion Covers than other cities
Ahmedabad
Ahmedabad over-indexes in wall clocks more than any other major city favouring bold, statement wall pieces. Decor here tends to be focal and visible.
102% higher preference for Clocks than other cities
Clocks AOV higher than national average
Jaipur
Jaipur shows one of the strongest concentrations in wall decor among all cities. It is the most visually expressive decor market in the dataset.
30% higher preference for Wall Decor than other cities
Indore
Indore’s decor demand is disproportionately concentrated in wall decor, signalling a strong shift toward statement styling. It is one of the most decor-forward Tier-2 cities.
20% higher preference for Wall Decor than other cities
Wall Decor AOV higher than national average
Surat
Surat leans heavily toward wall decor within its mix, with a higher concentration than most metros. The city shows strong appetite for visible, aesthetic upgrades.
15% higher preference for Wall Decor than other cities
40% higher preference for Cushion Covers than other cities
Vadodara
Vadodara’s decor mix is strongly weighted toward wall decor relative to other categories. It reflects a high visual-expression bias within a smaller market.
30% higher preference for Cushion Covers than other cities
Bhopal
Bhopal retains a relatively stronger share of bedsheets within its mix compared to larger metros. It is comparatively more essentials-leaning.
40% higher preference for Bedsheets than other cities
Lucknow
Lucknow over-indexes in bedsheets more than most cities in the dataset. Home upgrades here skew toward core household textiles.
70% higher preference for Bedsheets than other cities
Coimbatore
Coimbatore shows a stronger mix share in storage and utility categories than decor-heavy metros. It leans practical over purely aesthetic.
20% higher preference for Storage than other cities
Lower preference than national average for Cushion Covers
Chandigarh
Chandigarh’s mix is disproportionately tilted toward rugs and carpets relative to similar-sized cities. The city invests in floor-led decor statements.
40% higher preference for Rugs than other cities
Rugs AOV higher than national average
Dehradun
Dehradun shows high concentration in wall decor within its category mix. Decor here is expressive despite smaller market size.
18% higher preference for Wall Decor than other cities
Goa
Goa over-indexes most sharply in lamps and lighting. It is the most mood-driven decor market in the dataset.
147% higher preference for Lamps & Lighting than other cities
Lighting AOV 20% higher than national average
Thiruvananthapuram
Thiruvananthapuram’s category mix skews more toward essentials and storage than statement decor. It is one of the more function-first markets.
15% higher preference for Storage than other cities
Lower preference than national average for Wall Decor products
The 2026 Trend Radar
Mainstream
Emerging
Rising
Earthy
Playful
Declining
Natural
Classic
Minimalist
Modern
Bohemian
Eclectic
Future Outlook
What We Expect in 2026
The following predictions are based on patterns already visible in 2025 where intent, behaviour, and purchase signals are beginning to converge.
1
Styled Storage Will Become a Default, Not a Choice
From utility-led
expectation-led
In 2026, storage that looks good will stop being a premium option. It will become the default expectation in Indian homes.
EARLY INDICATORS
Rising co-purchase of storage + decor objects 45% lift in attachment rate
Higher browse depth on open storage SKUs 3x lift in browsing intent
2
Homes Will Be Styled in Corners, Not Rooms
From room-level styling
modular, corner-led upgrades
In 2026, Indian homes will increasingly be styled in small, intentional modules — corners, shelves, and zones — rather than full-room makeovers.
EARLY INDICATORS
Growth in cross-category baskets 62% lift in multi category
Higher engagement with styling-led content vs category browsing 25% lift in browsing intent
3
Comfort Will Shift from Softness to Sensory Experience
From comfort as products
comfort as mood
In 2026, comfort will move beyond soft furnishings into a more sensory idea — combining lighting, texture, and visual calm.
EARLY INDICATORS
Growth in “warm”, “ambient”, “cozy” search terms 24+% lift in search terms
Longer browse times in comfort-led categories
4
Affordable Luxury Will Become the Primary Expression of Aspiration
From big upgrades
Finishing touches
In 2026, aspiration in Indian homes will be expressed less through large renovations and more through premium-looking finishing touches.
EARLY INDICATORS
9.5% increase in average price of products purchased across categories
16% increase in customer adoption of Luxe products
5
Emerging Cities Will Lead Styling Innovation, Not Follow It
From catching up
setting the pace
In 2026, Tier 2 and emerging cities will increasingly shape home styling trends, rather than simply adopting metro aesthetics.
EARLY INDICATORS
Rising search intent for aesthetic-led terms 35% lift in wall decor search intent 8% lift over style search intent
About Us
What is Home?
An address?
Just a place to sleep?
A roof over our heads?
Not quite...
Home is more than where our stuff lives. It has room for the many versions of us.
Each collection of objects represents an era. Each with its own purpose and shelf life, holding intangible parts of us. Every time life happens, we change. And so does our home. Additions and subtractions are made, in living rooms and personalities alike.
Load a new aesthetic.
Soak it in. Bask in it. Then make room for the next.
The truth is, home is not a mere destination. It’s a journey
We’re here so you never have to take that journey alone.
Curating the Journey called Home
Appendix
Glossary
Core Report Constructs
Vaaree Home Index
An annual composite benchmark that captures how Indian homes are evolving across styling, comfort, and space optimisation, using transaction, search, and browsing data from the Vaaree platform.
Styling Score
A composite index measuring how actively customers style their homes beyond functional basics, based on:
adoption of identity-led decor categories
repeat styling behavior
styling intent expressed through search and browsing
A higher score indicates stronger aesthetic expression and coordinated styling behavior.
Comfort Index
A composite index measuring how strongly households invest in softness, warmth, and comfort-led interiors, based on:
adoption of soft furnishing categories
upgrades and repeat purchases in comfort items
comfort-driven search and browsing behavior
Space-Saver Index
A composite index measuring how strongly households optimize for small-space living, using storage, organization, and multi-use solutions. It captures both adoption and depth of organizing behavior.
Index Baseline (100)
All index scores are normalized such that 100 represents the national average across Vaaree’s dataset. Scores above 100 indicate higher-than-average adoption; scores below 100 indicate lower-than-average adoption.
Category & Styling Concepts
Style Categories
Product categories primarily associated with aesthetic expression, including: wall décor, showpieces, vases, artefacts, lamps & lighting, artificial plants, and barware.
Comfort Categories
Categories associated with softness, warmth, and physical comfort, including: rugs & carpets, cushion covers, bedsheets, and related soft furnishings.
Storage / Organization Categories
Categories associated with space optimization and organization, including: storage containers, organizers, racks, shelves, baskets, and space-saving solutions.
Functional Chic
An aesthetic direction where utility products also function as décor, such as open shelves, premium organizers, and styled storage solutions.
Warm Minimalism
An aesthetic characterized by clean spaces softened with: earthy tones, textured rugs, warm lighting, and curated decor objects.
Soft Maximalism
An aesthetic defined by layered styling, color, and pattern — but with cohesion and restraint rather than visual clutter.
Modern Indian
A contemporary aesthetic infused with Indian sensibilities, including:
traditional motifs, warm metals, and culturally rooted design elements presented in modern forms.
Behavioral & Data Terms
Adoption
The extent to which customers purchase products from a category, typically measured as:
% of customers buying at least one item
units or orders per 1,000 orders
Repeat Purchase Rate
The percentage of customers who make an additional purchase within a defined time window (e.g., 90 days), used as a signal of sustained engagement.
Co-purchase / Bundle
Two or more products or categories purchased together within the same order, used to identify look-building and coordinated styling behavior.
Browse Depth
The average number of product detail pages viewed per visitor within a category, used as a signal of consideration and intent.
Search Intent
Customer intent inferred from on-site search queries, including both generic terms (e.g., “rug”, “lamp”) and style-led terms (e.g., “boho”, “modern”, “gold”).
Styled Corner / Look
A coordinated combination of products across categories (e.g., lamp + rug + plant) used to create a cohesive visual or functional zone within the home.
Emerging City
A non-metro or Tier 2 city showing rapid growth in adoption or index scores relative to its previous baseline.
YoY (Year-over-Year) Growth. Comparison of performance metrics in 2025 relative to 2024, adjusted for category availability and platform activity where relevant.
Availability / Assortment
The number of SKUs or product options available within a category during a given period, used to contextualize demand growth.
Directional Trend
A trend identified based on consistent movement across multiple signals (purchase, search, browsing), intended to show directional change rather than population-wide penetration.
Appendix
Methodology
Overview
The Vaaree Home Index 2025 is based on anonymized and aggregated data from the Vaaree platform, combining transactional, behavioral, and search signals to identify emerging trends in home décor and styling.
The methodology is designed to:
enable fair comparison across cities
reduce bias from city size and platform scale
capture both adoption and intent
support repeatability in future editions
1. Data Sources
The analysis draws from three primary data streams:

a) Transaction Data
Orders placed between 1 Jan 2024 and 31 Dec 2025
Units sold, order composition, repeat purchases
Category- and city-level aggregation

b) Behavioral Data
On-site sessions and page views
Category and product page engagement
Browse depth, click-through behavior, add-to-cart signals

c) Search Data
On-site search queries
Query frequency and category mapping
Style-led and intent-led keyword analysis
All data is anonymized and analyzed at an aggregate level.
2. Geographic Scope
Analysis covers India, with a focus on top 20 cities by activity
City-level insights are reported only where data volumes meet minimum reliability thresholds
Cities are grouped into metro and emerging categories for comparative analysis
3. Category Framework
48 categories and ~150 product types analyzed
Categories grouped into:
Style-led categories
Comfort-led categories
Storage & organization categories
Category availability (assortment size) is tracked to contextualize demand growth
4. Trend Identification
A trend is identified when multiple signals move consistently in the same direction, including:
sustained YoY growth in adoption
rising search interest
increased browsing or co-purchase behavior
Single-signal spikes are not treated as trends.
5. Index Construction
Each index (Styling Score, Comfort Index, Space-Saver Index) is constructed using a weighted combination of:
Adoption metrics (what people buy)
Behavioral metrics (how people browse)
Intent metrics (what people search for)
6. Normalization & Comparability
To ensure fair comparisons:
Metrics are normalized per 1,000 orders or per 1,000 visitors
Index values are relative, not absolute
City rankings reflect relative adoption intensity, not total population size
7. Year-over-Year Comparisons
YoY growth is measured relative to 2024 baselines
Growth rates are interpreted directionally
Where categories expanded significantly in assortment, availability is considered during interpretation
8. Limitations
The report reflects behavior within Vaaree’s customer base and platform ecosystem
It does not measure total population-level penetration
Indices should be interpreted as directional benchmarks, not absolute rankings of cities or households
9. Repeatability
The methodology is designed to be reused annually, enabling:
consistent year-over-year comparisons
tracking of emerging cities and categories
refinement of indices as data depth increases
Appendix
Data notes and limitations
Indices are relative measures and should be interpreted directionally rather than as absolute rankings.
This report reflects directional trends observed within Vaaree’s customer base, not population-wide penetration. What makes it meaningful is how consistently these patterns appear across cities, categories, and behaviors — purchases, browsing, and search intent.
The Vaaree Home Index is designed to capture directional shifts, not absolute market size.
City rankings are normalized by activity — not total volume. A smaller city can rank higher than a metro if adoption intensity is stronger. That’s why cities like Indore, Lucknow, and Nagpur show up as fast movers.
We track category availability separately from demand. Where assortment expanded significantly, we interpret growth using per-order and per-customer adoption, not just raw units.
High growth rates often reflect early adoption curves rather than mass penetration. We therefore interpret large percentage changes as signals of emerging behavior, not maturity.
A trend is identified only when multiple independent signals move in the same direction — typically purchase adoption, search intent, and browsing behavior — over a sustained period.
Home Index 2025
by Vaaree
Based on real data from 500,000+ customers across India, this report captures the evolving relationship between people and their living spaces.
© 2026 Vaaree

Home Index

2025

How India styled its homes in 2025

About Home Index

The Vaaree Home Index 2025 examines how Indian homes are evolving. What people buy, how they style their spaces, and what this says about everyday life. This edition draws on data across 100,000+ products and 50+ million sessions, and is designed as a repeatable benchmark of changing tastes and emerging trends.

By combining transaction data with search and browsing behaviour, the report captures both intent and action. Together, these signals help us see that homes moved beyond functional basics and towards more intentional, cohesive styling. They have became an active expression of comfort, identity, and aspiration.

Table of Content

  1. Executive Summary
  2. The Vaaree Dataset
  3. The Vaaree Home Index
  4. The 10 Trends of 2025
  5. Regional & City Insights
  6. The Forecast: 2026
  7. Appendix

The 2025 Home in 5 Shifts

Walls Became Identity 1

Walls Became Identity

Indian homes increasingly used walls as the primary styling surface to express personality without changing the space.

signals

64% increase in wall decor adoption, making it one of the strongest drivers of styling behaviour.
Storage Became Aesthetic 2

Storage Became Aesthetic

Organization shifted from utility to lifestyle. Storage became visible, design-led products — not hidden necessities.

signals

168% increase in adoption for storage & organisers

4x increase in multi-item storage basket adoption

Comfort Became Design 3

Comfort Became Design

Softness and warmth moved from nice-to-have to must-have. Rugs, cushions, and bedsheets became anchors of comfort-led interiors.

signals

141% increase in adoption of Comfort category products

90% higher adoption for rugs/carpets

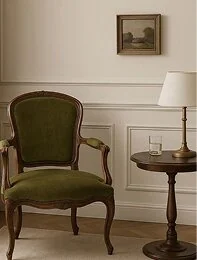
Lighting Became Mood 4

Lighting Became Mood

Lighting shifted from brightness to atmosphere. Homes increasingly used lamps and ambient lighting as part of décor.
signals

70% increase in adoption of lamps & lighting

Majority customers searched for warm or ambient lighting styles

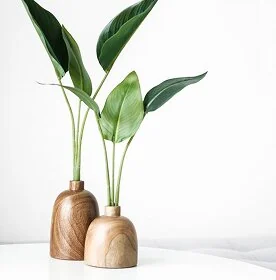
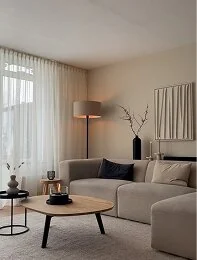
Consumers Buy Looks, Not Products 5

Consumers Buy Looks, Not Products

Home styling became modular. Customers increasingly built coordinated looks through cross-category combinations.
signals

62% increase in cross-category purchase

Wall Art + Wall Accents was the preferred purchase combination

3 Big Contradictions

These gaps between browsing and buying reveal where aspiration is running ahead of adoption, which is often the earliest signal of future trends.
Classic decor browsed
WHAT CUSTOMERS BROWSED

3.5 million shoppers browsed 'Classic' decor (10% higher than minimalist decor)

WHAT CUSTOMERS PURCHASED

Yet, minimalist decor products outsold classic by 25%

Minimalist decor purchased
Classic rugs browsed
WHAT CUSTOMERS BROWSED

400K+ shoppers viewed Classic rugs (22% higher than modern design rugs)

WHAT CUSTOMERS PURCHASED

Yet, modern rugs had 60% more orders than classic rugs

Modern rugs purchased
Natural furnishings browsed
WHAT CUSTOMERS BROWSED

“Natural” furnishings design had 1M views (34% higher than minimalist products)

WHAT CUSTOMERS PURCHASED

But, minimalist design furnishings had 20% higher order than natural design furnishings

Minimalist furnishings purchased

Why Homes Changed in 2025

In 2025, the Indian home continued its shift from being purely functional to deeply personal. Across India, people weren’t just decorating, they were shaping comfort, forming small daily rituals, and using their spaces to reflect who they are. Across Vaaree’s dataset, categories tied to comfort, storage, and identity consistently outpaced functional basics in growth.

Why homes changed

At its core, the 2025 home was about one simple thing: making everyday life feel better through warmth, order, mood, and self-expression.

Some of this change is structural. Homes are getting smaller, cities denser, and work more hybrid, turning the home into a space that has to do many jobs at once. But there’s an emotional layer too. After years of constant lifestyle change, people are spending more time indoors and asking more of their homes. More warmth. Better organisation. A stronger sense of personality.

The clearest signal in 2025 was the rise of intentional styling. Categories that once felt optional: wall art, mood lighting, styling accents, premium organisers started to behave like essentials. Comfort-led categories such as rugs and soft furnishings picked up pace. Functional items like racks, shelves, and containers began to matter not just for utility, but for how they looked.

What stood out wasn’t just higher consumption, but greater discernment. People moved away from buying isolated products and towards building cohesive looks. This showed up clearly in search behaviour, with growing use of style-led terms like “modern,” “boho,” “minimal,” “warm,” and “gold.” Purchases followed the same pattern, with stronger adoption of identity-led and comfort-led categories.

The Aesthetic Spectrum

Indian homes didn’t move in one direction, rather, they spread across a spectrum of aesthetics. What we observed wasn’t a single trend, but four dominant styling directions that defined the year.

These aesthetics are not mutually exclusive. Many homes blend them. Together, they reveal the core story of 2025: the home became more personal, intentional, and design-aware.

Warm Minimalism

Warm Minimalism

Clean spaces, but with warmth: earthy tones, textured rugs, mood lighting, curated objects.

Soft Maximalism

Soft Maximalism

More colour, more layers but cohesive. Patterned cushions, statement wall decor, bold artefacts.

Modern Indian

Modern Indian

Contemporary design infused with Indian sensibility, traditional motifs, warm metals, design that feels rooted yet current.

Functional Chic

Functional Chic

The fastest-growing aesthetic: storage that looks premium, organization as styling, shelves that become décor.

The Vaaree
Data Lens

This report combines what people bought, what they searched for, and how they browsed not opinions or surveys. That triangulation is what turns commerce data into cultural insight.

Time period: 1st Jan 2024 to 31st December 2025

Geography: India, with focus on top 20 cities

48
categories
1M+
Searches
85,000+
SKUs in Catalog
500K
Customers
100M+
Product views
150
Product types
1M+
Units sold
Introducing

Vaaree Home Index

The three indexes represent the three dominant forces shaping Indian homes today: expression, comfort, and space efficiency. Together, they capture the majority of observed home styling behaviour without over-complicating interpretation.
The Styling
Index

National Average Index
77
Styling Index

Style index indicates how much a city and customer segment styles their home beyond functional basics i.e., how much they buy for “aesthetic expression.”

A high Styling index means:

Purchase aesthetic and identity-led decor at a higher rate relative to overall home purchases
Style across multiple categories rather than making isolated purchases
Show strong styling intent through search and browsing behaviour

Mumbai continues to lead the way in home styling.

Jaipur jumps 4 positions to become the second most stylish city!

Indore, Lucknow, and Nagpur have taken massive leaps forward in home styling in 2025.
Styling Leaderboard
(Rank difference of 2025 vs 2024)
1
Mumbai
1
1
Jaipur
4
2
1
Bangalore
3
1
Indore
8
4
1
Delhi NCR
3
5
6
Ahmedabad
4
7
Lucknow
8
8
Pune
3
9
Nagpur
8
10
Kolkata
6
11
Chandigarh
3
12
Goa
5
13
Hyderabad
4
14
Bhopal
4
15
Chennai
1
16
Dehradun
17
Surat
6
18
Vadodara
5
19
Thiruvananthapuram
20
Coimbatore
Styling Leaderboard
(Rank difference of 2025 vs 2024)
1
Mumbai
(120)
1
1
Jaipur
(119)
4
2
1
Bangalore
(116)
3
1
Indore
(116)
8
4
1
Delhi NCR
(115)
5
3
6
Ahmedabad
(115)
4
7
Lucknow
(112)
8
8
Pune
(110)
3
9
Nagpur
(107)
8
10
Kolkata
(105)
6
11
Chandigarh
(102)
3
12
Goa
(102)
5
13
Hyderabad
(100)
4
14
Bhopal
(99)
4
15
Chennai
(97)
1
16
Dehradun
(96)
17
Surat
(94)
6
18
Vadodara
(93)
5
19
Thiruvananthapuram
(88)
20
Coimbatore
(83)
2

The Comfort
Index

National Average Index
47
Comfort Index

The comfort index indicates how strongly customers are optimising their homes for comfort, softness, and coziness. A shift toward home-as-retreat.

A high comfort index means:

Purchase comfort categories more frequently relative to overall home purchases
Show repeat and upgrade behaviour in soft furnishings
Express strong comfort intent through search and browsing

Mumbai leads in home comfort, with Bangalore and Hyderabad closing in fast.

Lucknow & Jaipur take big leaps forward in the comfort index compared to last year.
Comfort Leaderboard
(Rank difference of 2025 vs 2024)
1
Mumbai
1
1
Bangalore
1
2
1
Hyderabad
2
3
1
Kolkata
2
4
1
Ahmedabad
3
5
6
Lucknow
6
7
Chennai
1
8
Delhi ncr
1
9
Pune
5
10
Jaipur
7
11
Goa
2
12
Indore
8
13
Nagpur
2
14
Chandigarh
2
15
Coimbatore
16
Surat
2
17
Dehradun
2
18
Vadodara
19
Thiruvananthapuram
9
20
Bhopal
7
Comfort Leaderboard
(Rank difference of 2025 vs 2024)
1
Mumbai
(116)
1
1
Bangalore
(111)
1
2
1
Hyderabad
(95)
2
3
1
Kolkata
(95)
2
4
1
Ahmedabad
(94)
3
5
6
Lucknow
(94)
6
7
Chennai
(94)
1
8
Delhi NCR
(93)
1
9
Pune
(92)
5
10
Jaipur
(77)
7
11
Goa
(76)
2
12
Indore
(74)
8
13
Nagpur
(73)
2
14
Chandigarh
(70)
2
15
Coimbatore
(69)
16
Surat
(68)
2
17
Dehradun
(64)
2
18
Vadodara
(60)
19
Thiruvananthapuram
(59)
9
20
Bhopal
(59)
7
3

The Space-
Saver Index

National Average Index
50
Space-Saver Index

Space-saver index indicates how strongly households optimise for small-space living using storage, organisation, and multi-use solutions.

A high space-saver index means:

Adopt storage and organisation products at a higher rate per order
Engage in deeper organising behaviour rather than one-off purchases
Show strong intent to optimise space through search and browsing

Mumbai jumps two position to lead the space saver index.

Nagpur moved up 9 positions, while Indore dropped by 6 positions in the space-saver index.

Space-saver Leaderboard
(Rank difference of 2025 vs 2024)
1
Mumbai
2
1
1
Bangalore
2
1
Chennai
2
3
1
Coimbatore
3
4
1
Hyderabad
1
5
6
Pune
1
7
Delhi ncr
1
8
Ahmedabad
2
9
Kolkata
2
10
Lucknow
1
11
Nagpur
9
12
Thiruvananthapuram
13
Surat
2
14
Indore
6
15
Goa
4
16
Chandigarh
17
Vadodara
4
18
Jaipur
4
19
Bhopal
1
20
Dehradun
3
Space-saver Leaderboard
(Rank difference of 2025 vs 2024)
1
Mumbai
(118)
2
1
1
Bangalore
(117)
2
1
Chennai
(117)
2
3
1
Coimbatore
(104)
3
4
1
Hyderabad
(103)
1
5
6
Pune
(94)
1
7
Delhi NCR
(94)
1
8
Ahmedabad
(87)
2
9
Kolkata
(85)
2
10
Lucknow
(82)
1
11
Nagpur
(78)
9
12
Thiruvananthapuram
(78)
13
Surat
(71)
2
14
Indore
(70)
6
15
Goa
(70)
4
16
Chandigarh
(69)
17
Vadodara
(64)
4
18
Jaipur
(64)
4
19
Bhopal
(64)
1
20
Dehradun
(55)
3
Trend 01

Walls Became
Identity

In 2025, walls became the new “identity surface” of Indian homes to easily style a space without changing it. Customers weren’t just buying individual products, they were building walls as expressions of personality: modern, boho, minimal, traditional, maximalist, etc.

220% lift in repeat customer preference

70% increase in unites sold for Wall decor

Key reasons for this trend

Homes became personal brands, with walls serving as the most visible expression of taste.

Wall décor offers a high-impact upgrade that’s easy to change, especially for renters.

Social media shifted décor shopping toward aesthetic-led language and inspiration.

In demand Art forms

Pichwai
Macrame
Madhubani
Jharokha

Rising Subjects

7 Horses
Lotus
Evil Eye
Tree of Life

How to Style your wall?

Build a theme wall: one material + one palette + one anchor piece

Pair wall décor with warm lighting (table lamp / wall light) to create depth
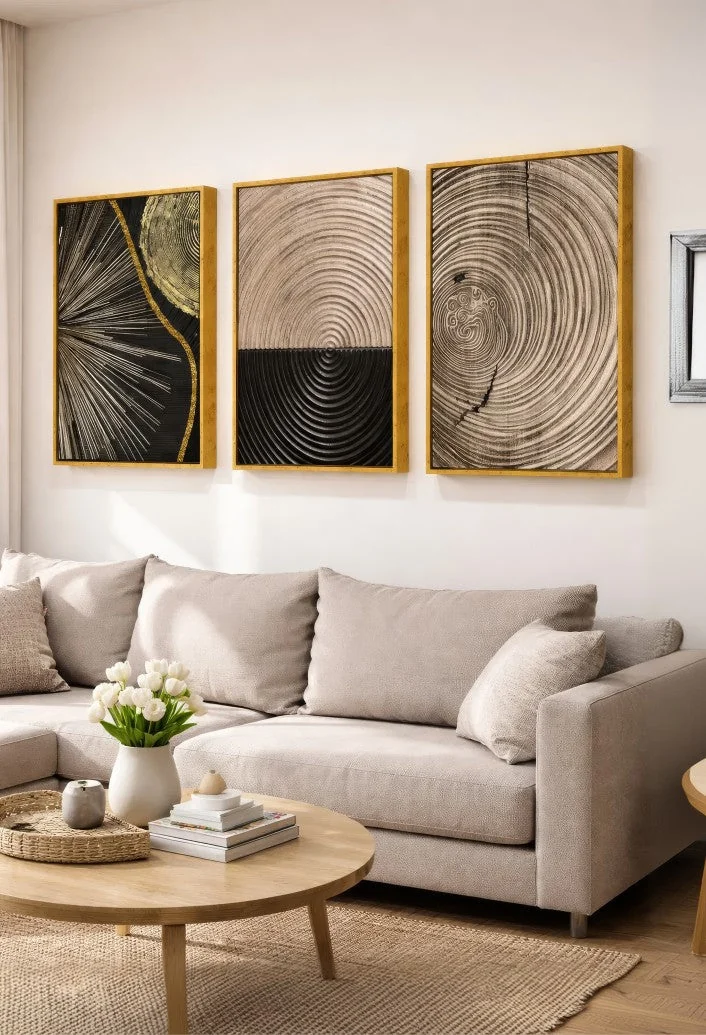
Use “rule of three”: 3 frames / 3 artefacts / 3 visual elements

For small spaces: choose vertical elements (mirrors, tall frames) to increase height

Trend 02

Storage Became
Aesthetic

In 2025, storage wasn’t just about organisation. It became a design category. Consumers increasingly chose containers, shelves, racks, and organisers that looked premium and complemented the home’s aesthetic.

Key reasons for this trend

Compact Indian homes are driving demand for smart, space-saving storage that blends function with design.

Home organization has evolved into an aspirational lifestyle fueled by decluttering and productivity culture.

Consumers now expect organizers to be both highly functional and visually pleasing for open display.

270% growth in home storage & organisation

1.35 average storage units per storage orders
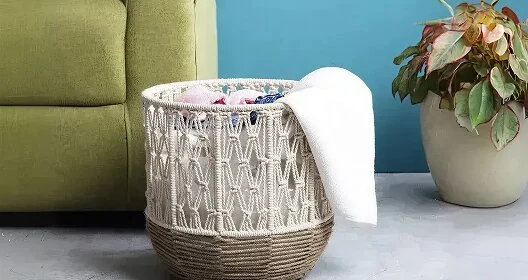
Leading organiser types

Kitchen
Keys
Shoes
Clothes

Tips to organise aesthetically

Use open storage as display : baskets + styling objects
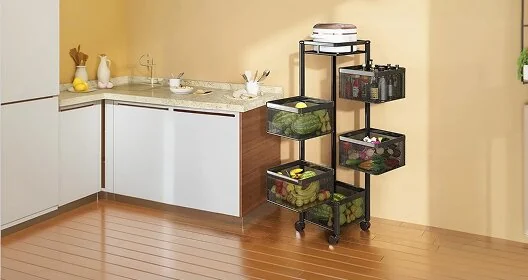
Create visible zones: kitchen, bathroom, entryway
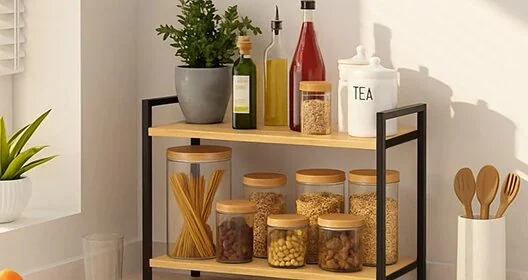
Pair storage with plants or showpieces to soften utilitarian forms
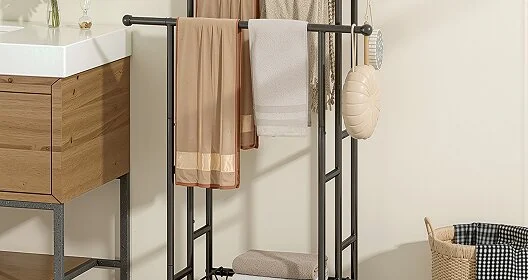
For small spaces: stack vertically (tall racks, shelves)

Trend 03

Lighting became
Mood

In 2025, lighting moved from utility to atmosphere, where homes began to style with mood, not brightness. Customers increasingly treated lamps and ambient lighting as part of décor especially as homes became more experiential spaces for relaxing, working, and hosting.

Tips for ambient lightning

Create a mood corner: lamp + rug + plant
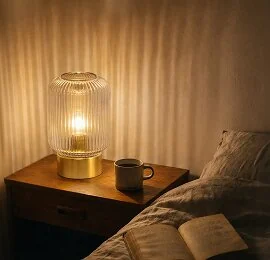
Use warm light (not harsh white) in living spaces

Mix heights: table lamp + floor lamp + wall accents
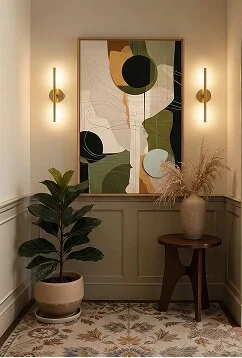
Place lighting beside frames/art to create depth

Key reasons for this trend

As rooms serve multiple purposes, lighting enables quick mood changes without altering the setup.

Consumers now value warmth, ambience, and coziness over purely functional lighting.

Lamps have become styling elements that complement decor pieces to create curated corners.

70% increase in adoptions of lamps & lightning

Top searched lamp materials

Wooden
Ceramic
Rattan
Fabric
Trend 04

The Comfort
Economy

In 2025, comfort became a design choice. Softness moved from “nice-to-have” to “must-have.” Comfort categories like rugs, carpets, bedsheets, and cushion covers saw strong momentum in 2025 not only as functional upgrades, but as styling anchors. Instead of treating soft furnishings as basics, customers increasingly used them to set the mood of a room: warm textures, layered surfaces, and softer palettes.

Key reasons for this trend

Homes are now seen as emotional sanctuaries where comfort supports daily well-being.

Soft furnishings offer the quickest, low-commitment way to transform a room’s look and feel.

Consumers are shifting from print-focused choices to texture-driven, mood-based styling.

102% Growth in Rugs & Carpets GMV

42% Increase in ASP for cushion covers
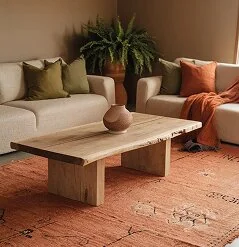
Top comfort searches

Bedsheet
Cushion cover
Curtains
Rug
Carpet
Sofa Cover

How to Style it?

Start with a rug, use it to anchor the palette of the room

Use “tone-on-tone” neutrals for warmth without clutter

Refresh seasonally: lighter fabrics in summer, deeper tones in winter

Layer softness: rug + cushion covers + warm lighting

Trend 05

Nature Moves
Indoors

In 2025, Indian homes brought nature inside. Greenery became an aesthetic language, not just decor. Artificial plants and nature-inspired styling became one of the clearest signals of the "calmer home" trend. For many homes, greenery served as the bridge between function and beauty.

Key reasons for this trend

Warm minimalism has elevated natural textures and greenery as core elements of modern interiors.

Plants offer an easy, renter-friendly way to refresh spaces without major changes.

Greenery helps urban homes reclaim a sense of openness, freshness, and calm.

109% growth in orders for artificial plants and flowers

82% Growth in search intent: "artificial plants", "green decor", "indoor plants"
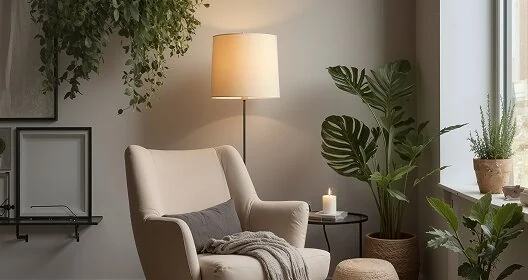
Cities with highest
greenery adoption in 2025

Goa
Lucknow
Thiruvananthapuram
Bangalore
Delhi NCR

Most searched plant terms

Dried flowers
Pampas grass
Coral Tree
Sunflowers
Monstera
Bougainvillea
Orchid
Olive Tree
Palm Plant
Almiro Tree
Fiddle Leaf

How to style your green corner?

Create a green corner: plant + lamp + small rug
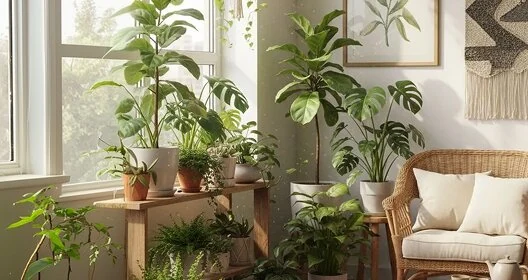
Use height variation: floor plant + table plant + hanging option
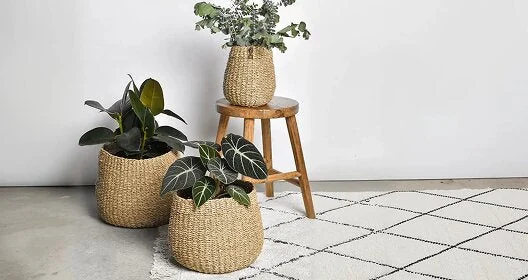
Pair greenery with neutral storage baskets for "functional chic"
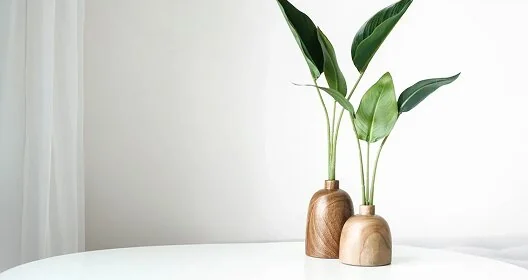
Add a vase/artefact to make it feel curated

Trend 06

The 'Functional
Chic' Home

In 2025, the most modern homes weren't the most decorative they were the most functional, styled beautifully.

Racks, shelves, and organisers weren't just bought as storage, they were increasingly used as display infrastructure. Customers treated shelves as design elements, and racks as part of the room's aesthetic rather than something hidden away.

This shift marks the rise of "functional chic". Utility products act as the canvas for styling. Shelves hold plants and showpieces, organisers sit visibly on counters, and racks become part of kitchen and bathroom decor.
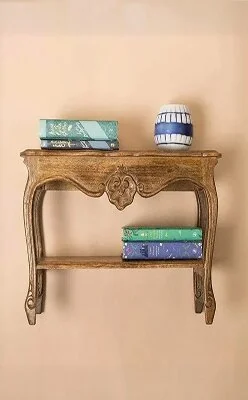
How to Style it?

Treat shelves like curated zones: 60% storage + 40% decor
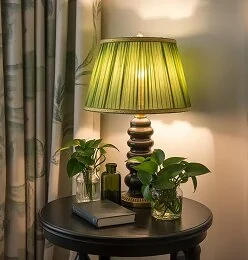
Add 1 plant + 1 lamp + 1 object for visual balance
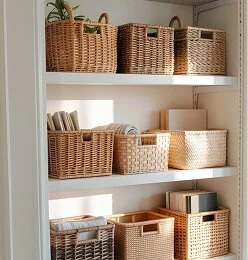
Use baskets and containers for hidden storage within open shelves
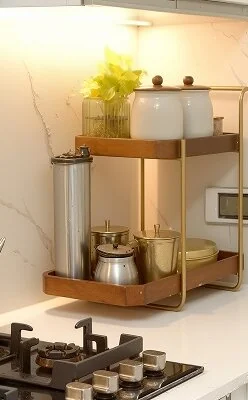
Keep a consistent palette (neutral baskets + warm metals + greenery)

Key reasons for this trend

Limited floor space pushed homes toward vertical storage, making shelf design as important as function.

Utility organizers are now expected to visually align with clean, minimal, and premium interiors.

Shelves have evolved into display systems that express personal style, not just storage.

300% Higher customer adoption for racks & shelves

13% of racks purchasers also bought organisers

200% Increase in search intent.

Leading search terms

Wall shelf
Shoe rack
Kitchen rack
Book shelf
Dish rack
Microwave stand
Trend 07

Affordable Luxury
Accents

In 2025, luxury didn't grow, Affordable luxury did. Homes chose "premium-looking" accents over expensive upgrades. Consumers increasingly expressed aspiration through small but high-impact upgrades: artefacts, showpieces, vases, premium decor objects, and statement accents. Rather than investing in big-ticket furniture, shoppers leaned into objects that elevate a space instantly and photograph beautifully.

Key reasons for this trend

Consumers are refreshing their spaces through small upgrades rather than full home renovations.

Greater exposure to aspirational design has made "everyday luxury" more attainable through accents.

Homes are increasingly curated to reflect personal taste through intentional, well-chosen objects.

60% growth in customers choosing luxury decor

300% faster adoption of luxury in decor vs space saving products
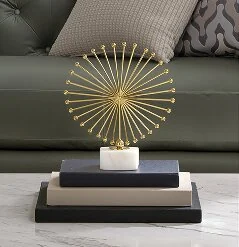
Top luxe intent search terms

Chandelier
Big vase
Sculpture
Designer wall clock
Golden Planter
Ceramic table lamp
Satin bedsheet
Brass decor
Fur Rug

How to Style it?

Use one "statement object" per zone

Pair premium objects with neutral palettes for contrast
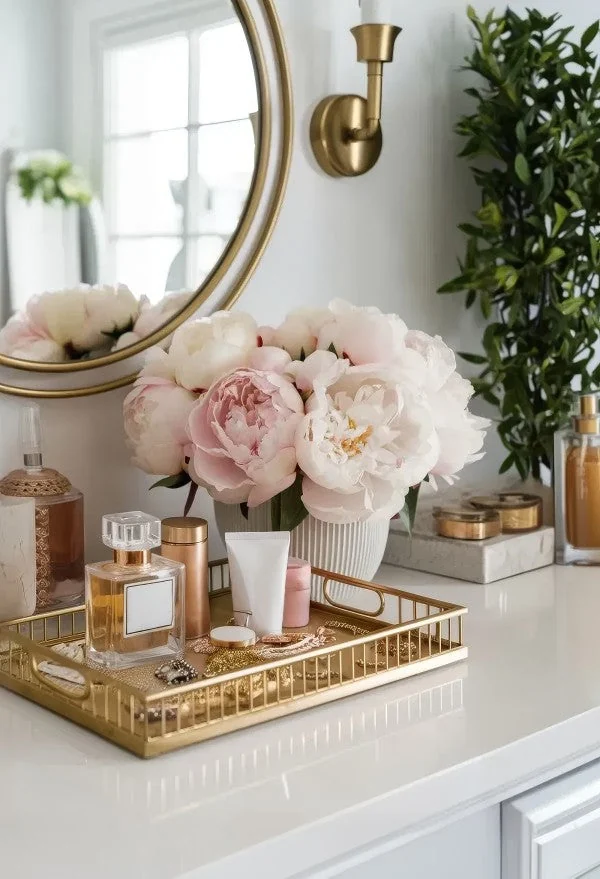
Choose a consistent metal tone (gold/brass/silver)
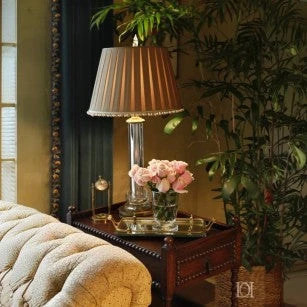
Place accents near lighting to create a luxury glow

Trend 08

The Styled Hosting
Home

In 2025, hosting became aesthetic. Barware and serving categories moved from kitchen storage to living room display. Barware, hosting, and serving aesthetics gained momentum in 2025, reflecting a deeper lifestyle shift: the home is increasingly a social space again. Consumers weren't just purchasing for functionality; they were building "hosting corners" — bar sets, glassware, trays, and statement serveware that also functions as decor.

Key reasons for this trend

Homes are increasingly serving as the main venue for socialising and hosting.

Social media has turned hosting setups into aspirational, style-led moments.

Barware reflects a shift toward intentional home rituals tied to celebration and identity.

72% growth in customers buying hosting products

400% hosting-led searches increased
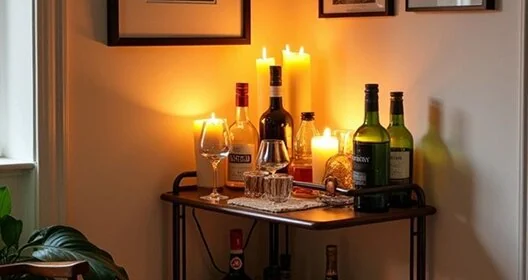
Most popularly paired products were Serving Trays with

Tissue Holders
Containers
Showpieces
Vases
Artificial flowers

Tips for aesthetic hosting

Create a hosting corner: shelf + barware + warm lamp
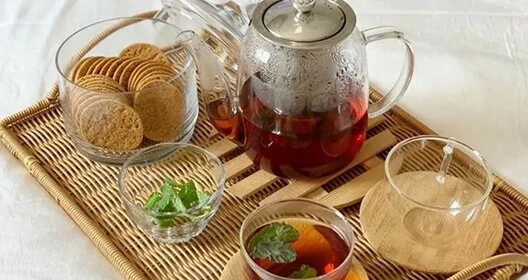
Use trays for "organized display"
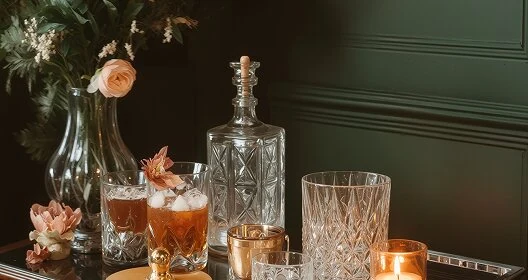
Pair glassware with one statement vase/object
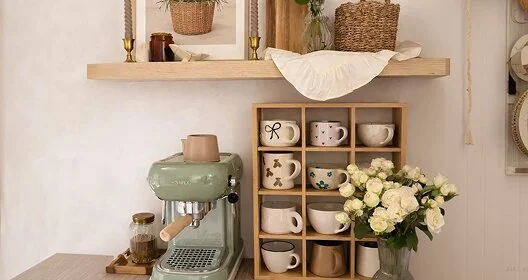
Keep a single theme: modern, vintage, or minimal

Trend 09

Festival Styling
Became Editorial

In 2025, festival decor shifted from tradition to trend where homes styled for festivals like they style for social media. Consumers showed increasing interest in cohesive festive themes: coordinated lighting, warm tones, premium-looking accents, and a curated aesthetic rather than scattered decoration.
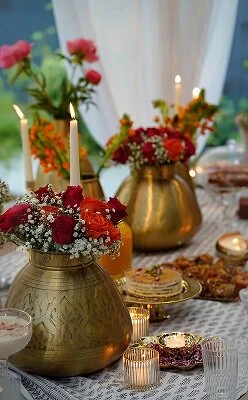
How to Style it?

Choose a theme: warm gold, earthy traditional, or modern minimal
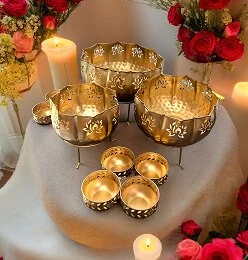
Use one statement decor object and repeat it (symmetry)
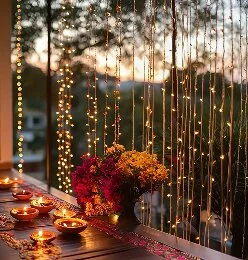
Layer lighting: warm lamps + string lights
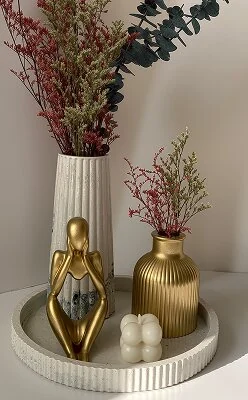
Refresh with reusable elements: trays, vases, premium artifacts

Key reasons for this trend

Festivals have evolved into lifestyle and social occasions, not just religious observances.

Consumers want traditions that feel modern, visual, and shareable.

Festivals are now key moments for home refresh and decor investment.

Cities with highest festive styling

Nagpur
Mumbai
Chandigarh
Delhi NCR
Indore
Trend 10

Buying Looks, Not Products

In 2025, customers increasingly bought coordinated looks; not individual products. Styling became modular and bundle-led. Customers weren't shopping in silos, they were shopping in combinations: wall decor paired with lighting, rugs paired with cushion covers, shelves paired with plants and artefacts. This behaviour suggests the rise of a more styling-aware consumer.

29% higher repeat behaviour for customers buying 3+ categories

580% higher conversion when browsing "Looks" instead of products

Key reasons for this trend

Consumers now buy decor as part of a cohesive vibe rather than standalone items.

Homes are styled in visual zones, influenced by content and social media framing.

Home upgrades are increasingly done in modular, corner-by-corner transformations.
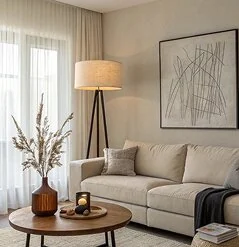
Tips to create the perfect look

Create a look formula: one anchor + two complements + one texture

Use height variety (small + medium + tall objects)

Repeat the same palette across the look

Geographic Analysis
City Spotlights
Delhi NCR
Delhi NCR is India’s most balanced decor market with no single category dominating, but strong depth across cushions, wall decor and soft furnishings. It reflects a broad, multi-category styling culture rather than a single-product bias.
No category has 100% higher preference than national average
Bangalore
Bangalore over-indexes in rugs and carpets, signalling a preference for layered, floor-led styling rather than surface-level accents. Buyers here invest in foundational decor pieces.
90% higher preference for Rugs & Carpets compared to other cities
Rugs AOV in Bangalore higher than national average
Mumbai
Mumbai stands out for its disproportionate spend on cushion covers and accent textiles. The city prefers quick visual upgrades over structural decor changes.
112% higher preference for Cushion Covers than other cities
Cushion AOV in Mumbai higher than national average
Hyderabad
Hyderabad shows a strong tilt toward cookware within the top categories blending decor with functional premium purchases. It’s the most utility-forward major metro in the dataset.
101% higher preference for Cookware than other cities
Cookware AOV higher than national average
Pune
Pune mirrors Mumbai’s accent-driven behaviour, with cushion covers significantly over-indexing. The city leans toward soft styling updates.
80% higher preference for Cushion Covers than other cities
Cushion AOV in Pune higher than national average
Chennai
Chennai over-indexes sharply in racks and shelves making it the most organisation-oriented city in the dataset. Storage and structure matter here.
139% higher preference for Racks & Shelves than other cities
Storage AOV in Chennai lower than national average
Kolkata
Kolkata shows a clear bias toward soft furnishings, especially cushions, over hard decor. Its styling preference is layered and textile-led.
87% higher preference for Cushion Covers than other cities
Ahmedabad
Ahmedabad over-indexes in wall clocks more than any other major city favouring bold, statement wall pieces. Decor here tends to be focal and visible.
102% higher preference for Clocks than other cities
Clocks AOV higher than national average
Jaipur
Jaipur shows one of the strongest concentrations in wall decor among all cities. It is the most visually expressive decor market in the dataset.
30% higher preference for Wall Decor than other cities
Indore
Indore’s decor demand is disproportionately concentrated in wall decor, signalling a strong shift toward statement styling. It is one of the most decor-forward Tier-2 cities.
20% higher preference for Wall Decor than other cities
Wall Decor AOV higher than national average
Surat
Surat leans heavily toward wall decor within its mix, with a higher concentration than most metros. The city shows strong appetite for visible, aesthetic upgrades.
15% higher preference for Wall Decor than other cities
40% higher preference for Cushion Covers than other cities
Vadodara
Vadodara’s decor mix is strongly weighted toward wall decor relative to other categories. It reflects a high visual-expression bias within a smaller market.
30% higher preference for Cushion Covers than other cities
Bhopal
Bhopal retains a relatively stronger share of bedsheets within its mix compared to larger metros. It is comparatively more essentials-leaning.
40% higher preference for Bedsheets than other cities
Lucknow
Lucknow over-indexes in bedsheets more than most cities in the dataset. Home upgrades here skew toward core household textiles.
70% higher preference for Bedsheets than other cities
Coimbatore
Coimbatore shows a stronger mix share in storage and utility categories than decor-heavy metros. It leans practical over purely aesthetic.
20% higher preference for Storage than other cities
Lower preference than national average for Cushion Covers
Chandigarh
Chandigarh’s mix is disproportionately tilted toward rugs and carpets relative to similar-sized cities. The city invests in floor-led decor statements.
40% higher preference for Rugs than other cities
Rugs AOV higher than national average
Dehradun
Dehradun shows high concentration in wall decor within its category mix. Decor here is expressive despite smaller market size.
18% higher preference for Wall Decor than other cities
Goa
Goa over-indexes most sharply in lamps and lighting. It is the most mood-driven decor market in the dataset.
147% higher preference for Lamps & Lighting than other cities
Lighting AOV 20% higher than national average
Thiruvananthapuram
Thiruvananthapuram’s category mix skews more toward essentials and storage than statement decor. It is one of the more function-first markets.
15% higher preference for Storage than other cities
Lower preference than national average for Wall Decor products

The 2026 Trend Radar

Emerging trend

Bohemian
Bohemian
Eclectic
Eclectic

Rising trend

Earthy
Earthy
Playful
Playful

Mainstream trend

Minimalist
Minimalist
Modern
Modern

Declining trend

Natural
Natural
Classic
Classic
Future Outlook

What We Expect in 2026

The following predictions are based on patterns already visible in 2025 where intent, behaviour, and purchase signals are beginning to converge.
1

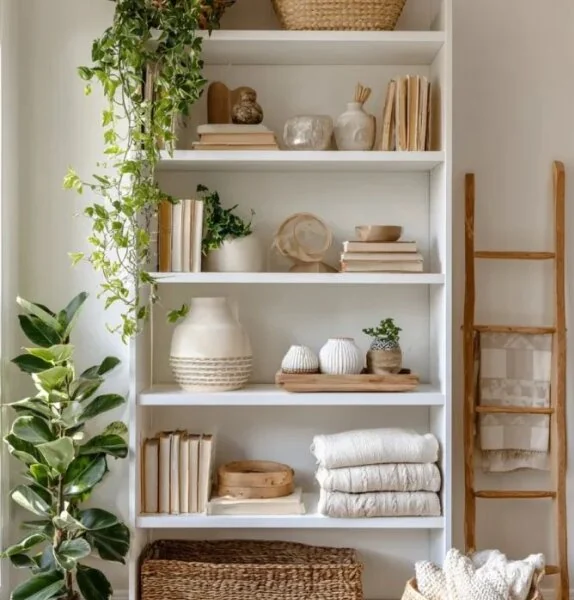
Styled storage will become a default, not a choice

From utility-led expectation-led

In 2026, storage that looks good will stop being a premium option. It will become the default expectation in Indian homes.

EARLY INDICATORS
Rising co-purchase of storage + decor objects 45% lift in attachment rate
Higher browse depth on open storage SKUs 3x lift in browsing intent
2

Homes will be styled in corners, not rooms

Room-level styling Corner-led upgrades

In 2026, Indian homes will increasingly be styled in small, intentional modules — corners, shelves, and zones — rather than full-room makeovers.
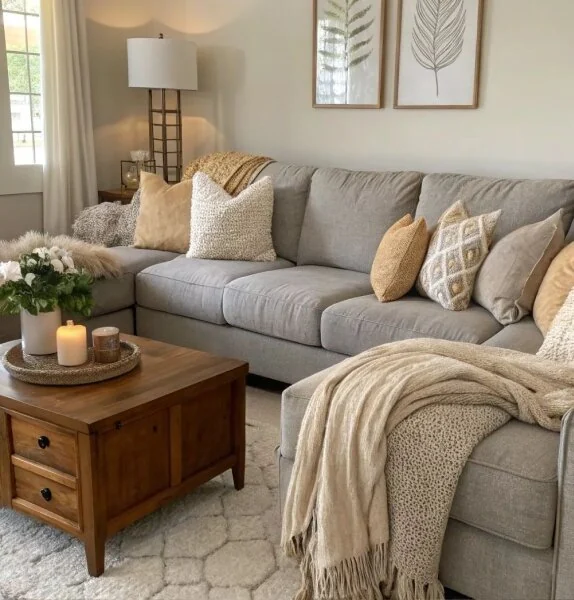
EARLY INDICATORS
Growth in cross-category baskets 62% lift in multi category
Higher engagement with styling-led content vs category browsing 25% lift in browsing intent
3

Comfort will shift from softness to sensory experience

Comfort as products Comfort as mood

In 2026, comfort will move beyond soft furnishings into a more sensory idea — combining lighting, texture, and visual calm.
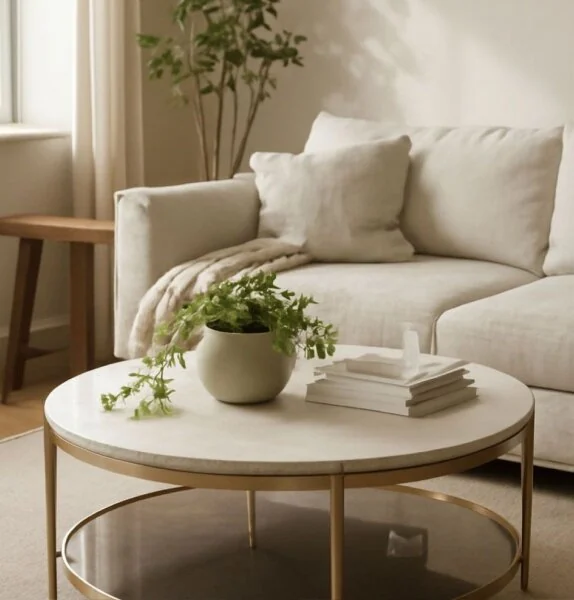
EARLY INDICATORS
Growth in "warm", "ambient", "cozy" search terms 24+% lift in search terms
Longer browse times in comfort-led categories
4

Affordable luxury will become an expression of aspiration

From big upgrades Finishing touches

In 2026, aspiration in Indian homes will be expressed less through large renovations and more through premium-looking finishing touches.
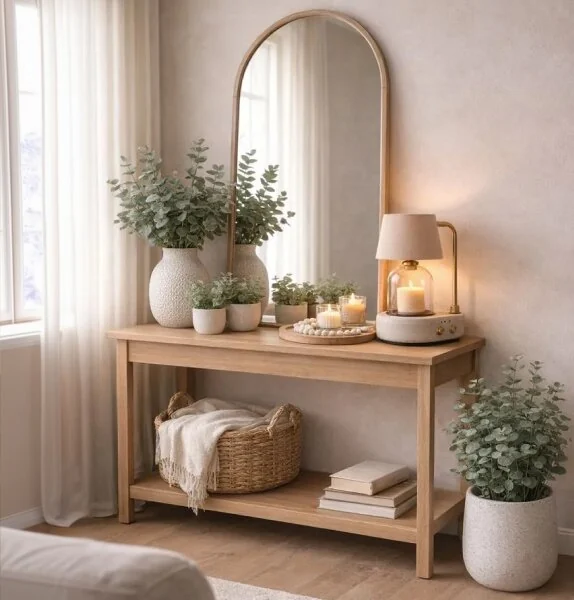
EARLY INDICATORS
9.5% increase in average price of products purchased across categories
16% increase in customer adoption of Luxe products
5

Emerging cities will lead styling trends, not follow it

From catching up Setting the pace

In 2026, Tier 2 and emerging cities will increasingly shape home styling trends, rather than simply adopting metro aesthetics.
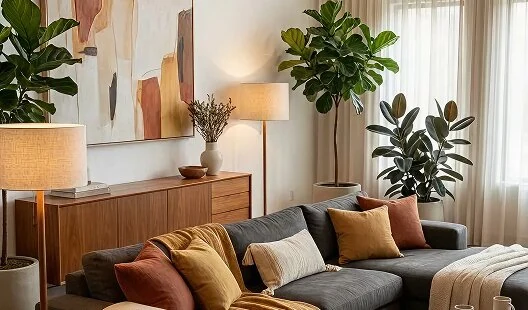
EARLY INDICATORS
Rising search intent for aesthetic-led terms 35% lift in wall decor search intent 8% lift over style search intent

About Us

About Us

What is Home?

An address?
Just a place to sleep?
A roof over our heads?

Not quite...

"

Home is more than where our stuff lives. It has room for the many versions of us.

Each collection of objects represents an era. Each with its own purpose and shelf life, holding intangible parts of us. Every time life happens, we change. And so does our home. Additions and subtractions are made, in living rooms and personalities alike.

Load a new aesthetic.
Soak it in. Bask in it. Then make room for the next.

The truth is, home is not a mere destination. It's a journey

We're here so you never have to take that journey alone.

Appendix

Glossary

Core Report Constructs

Vaaree Home Index
An annual composite benchmark that captures how Indian homes are evolving across styling, comfort, and space optimisation, using transaction, search, and browsing data from the Vaaree platform.
Styling Score
A composite index measuring how actively customers style their homes beyond functional basics, based on:
adoption of identity-led decor categories
repeat styling behavior
styling intent expressed through search and browsing
A higher score indicates stronger aesthetic expression and coordinated styling behavior.
Comfort Index
A composite index measuring how strongly households invest in softness, warmth, and comfort-led interiors, based on:
adoption of soft furnishing categories
upgrades and repeat purchases in comfort items
comfort-driven search and browsing behavior
Space-Saver Index
A composite index measuring how strongly households optimize for small-space living, using storage, organization, and multi-use solutions. It captures both adoption and depth of organizing behavior.
Index Baseline (100)
All index scores are normalized such that 100 represents the national average across Vaaree's dataset. Scores above 100 indicate higher-than-average adoption; scores below 100 indicate lower-than-average adoption.

Category & Styling Concepts

Style Categories
Product categories primarily associated with aesthetic expression, including: wall décor, showpieces, vases, artefacts, lamps & lighting, artificial plants, and barware.
Comfort Categories
Categories associated with softness, warmth, and physical comfort, including: rugs & carpets, cushion covers, bedsheets, and related soft furnishings.
Storage / Organization Categories
Categories associated with space optimization and organization, including: storage containers, organizers, racks, shelves, baskets, and space-saving solutions.
Functional Chic
An aesthetic direction where utility products also function as décor, such as open shelves, premium organizers, and styled storage solutions.
Warm Minimalism
An aesthetic characterized by clean spaces softened with: earthy tones, textured rugs, warm lighting, and curated decor objects.
Soft Maximalism
An aesthetic defined by layered styling, color, and pattern — but with cohesion and restraint rather than visual clutter.
Modern Indian
A contemporary aesthetic infused with Indian sensibilities, including:
traditional motifs, warm metals, and culturally rooted design elements presented in modern forms.

Behavioral & Data Terms

Adoption
The extent to which customers purchase products from a category, typically measured as:
% of customers buying at least one item
units or orders per 1,000 orders
Repeat Purchase Rate
The percentage of customers who make an additional purchase within a defined time window (e.g., 90 days), used as a signal of sustained engagement.
Co-purchase / Bundle
Two or more products or categories purchased together within the same order, used to identify look-building and coordinated styling behavior.
Browse Depth
The average number of product detail pages viewed per visitor within a category, used as a signal of consideration and intent.
Search Intent
Customer intent inferred from on-site search queries, including both generic terms (e.g., "rug", "lamp") and style-led terms (e.g., "boho", "modern", "gold").
Styled Corner / Look
A coordinated combination of products across categories (e.g., lamp + rug + plant) used to create a cohesive visual or functional zone within the home.
Emerging City
A non-metro or Tier 2 city showing rapid growth in adoption or index scores relative to its previous baseline.
YoY (Year-over-Year) Growth. Comparison of performance metrics in 2025 relative to 2024, adjusted for category availability and platform activity where relevant.
Availability / Assortment
The number of SKUs or product options available within a category during a given period, used to contextualize demand growth.
Directional Trend
A trend identified based on consistent movement across multiple signals (purchase, search, browsing), intended to show directional change rather than population-wide penetration.
Appendix

Methodology

Overview

The Vaaree Home Index 2025 is based on anonymized and aggregated data from the Vaaree platform, combining transactional, behavioral, and search signals to identify emerging trends in home décor and styling.
The methodology is designed to:
enable fair comparison across cities
reduce bias from city size and platform scale
capture both adoption and intent
support repeatability in future editions

1. Data Sources

The analysis draws from three primary data streams:

a) Transaction Data
Orders placed between 1 Jan 2024 and 31 Dec 2025
Units sold, order composition, repeat purchases
Category- and city-level aggregation

b) Behavioral Data
On-site sessions and page views
Category and product page engagement
Browse depth, click-through behavior, add-to-cart signals

c) Search Data
On-site search queries
Query frequency and category mapping
Style-led and intent-led keyword analysis
All data is anonymized and analyzed at an aggregate level.

2. Geographic Scope

Analysis covers India, with a focus on top 20 cities by activity
City-level insights are reported only where data volumes meet minimum reliability thresholds
Cities are grouped into metro and emerging categories for comparative analysis

3. Category Framework

48 categories and ~150 product types analyzed
Categories grouped into:
Style-led categories
Comfort-led categories
Storage & organization categories
Category availability (assortment size) is tracked to contextualize demand growth

4. Trend Identification

A trend is identified when multiple signals move consistently in the same direction, including:
sustained YoY growth in adoption
rising search interest
increased browsing or co-purchase behavior
Single-signal spikes are not treated as trends.

5. Index Construction

Each index (Styling Score, Comfort Index, Space-Saver Index) is constructed using a weighted combination of:
Adoption metrics (what people buy)
Behavioral metrics (how people browse)
Intent metrics (what people search for)

6. Normalization & Comparability

To ensure fair comparisons:
Metrics are normalized per 1,000 orders or per 1,000 visitors
Index values are relative, not absolute
City rankings reflect relative adoption intensity, not total population size

7. Year-over-Year Comparisons

YoY growth is measured relative to 2024 baselines
Growth rates are interpreted directionally
Where categories expanded significantly in assortment, availability is considered during interpretation

8. Limitations

The report reflects behavior within Vaaree's customer base and platform ecosystem
It does not measure total population-level penetration
Indices should be interpreted as directional benchmarks, not absolute rankings of cities or households

9. Repeatability

The methodology is designed to be reused annually, enabling:
consistent year-over-year comparisons
tracking of emerging cities and categories
refinement of indices as data depth increases

Appendix

Data notes &
limitations

The Vaaree Home Index 2025 is based on anonymized and aggregated data from the Vaaree platform, combining transactional, behavioral, and search signals to identify emerging trends in home décor and styling.
The methodology is designed to:
enable fair comparison across cities
reduce bias from city size and platform scale
capture both adoption and intent
support repeatability in future editions

custom_html